
Summary
What is the M language? The so-called M language is a set of programmatic functions that extend from the early stock trading technical indicators. Encapsulating the algorithm into a single function, the user only needs to call a certain function like "building blocks" to implement the strategy logic.

It adopts the construction mode of " small grammar, big function " , which greatly improves the programming efficiency. The strategy writing of more than 100 sentences in other languages can be compiled with only few lines in M languages. The financial statistical function library and data structure in conjunction with the FMZ Quant tool can also support some complex trading logic.
Complete strategy
In order to help you quickly understand the key knowledge of this section, before introducing the FMZ Quant M language, let's first have a preliminary understanding of the noun concept of this section. We will still use the long-term 50-day moving average and the short-term 10-day moving average as the basic case, and review the complete strategy case mentioned in the previous chapter:
-
Open long position: If there is currently no position, and the closing price is greater than the short-term moving average, and the closing price is greater than the long-term moving average, and the short-term moving average is greater than the long-term moving average, and the long-term moving average is rising.
-
Open short position: If there is currently no position, and the closing price is less than the short-term moving average, and the closing price is less than the long-term moving average, and the short-term moving average is less than the long-term moving average, and the long-term moving average is falling.
-
Close Long position: If currently hold long position, and the closing price is less than the long-term moving average, or the short-term moving average is less than the long-term moving average, or the long-term moving average is falling.
-
Close Short position: If current hold short position, and the closing price is greater than the long-term moving average, or the short-term moving average is greater than the long-term moving average, or the long-term moving average is rising.
If you write it by M language, it will be:
MA10:=MA(CLOSE,10); // Get the 10-cycle moving average of the latest K-line and save the result in variable MA10
MA50:=MA(CLOSE,50); // Get the 50-cycle moving average of the latest K-line and save the result in variable MA50
MA10_1:=REF(MA10,1); //Get the 10-cycle moving average of the pervious K line and save the result to variable MA10_1
MA50_1:=REF(MA50,1); //Get the 50-cycle moving average of the pervious K line and save the result to variable MA50_1
MA10_2:=REF(MA10,2); //Get the 10-cycle moving average of the latest K line and save the result to variable MA10_2
MA50_2:=REF(MA50,2); //Get the 50-cycle moving average of the latest K line and save the result to variable MA50_2
MA50_ISUP:=MA50>MA50_1 AND MA50_1>MA50_2; //Determine whether the current 50-line moving average of the K line is rising
MA50_ISDOWN:=MA50<MA50_1 AND MA50_1<MA50_2; //Determine whether the current 50-line moving average of the K line is falling
CLOSE>MA10 AND CLOSE>MA50 AND MA10>MA50 AND MA50_ISUP,BK; //open long position
CLOSE<MA10 AND CLOSE<MA50 AND MA10<MA50 AND MA50_ISUP,SK; //open short position
CLOSE<MA50 OR MA10<MA50,SP;//close long position
CLOSE>MA50 OR MA10>MA50,BP;//close short position
To write a complete trading strategy, you will need : data acquisition, data calculation, logic calculation, and placing orders. As shown in the above, in the entire code, only one API for getting the basic data is used , which is the " CLOSE " in the first and second lines ; then the first to the ninth lines are the data calculation parts; Lines 11 through 14 are logical calculations and placing order part.
Note that the MA10, MA50, MA10_1, MA50_1, MA10_2, and MA50_2 are variables; in the first to ninth lines, the " := " is an assignment sign, and the data to the right of the assignment sign is assigned to the variable to the left of the assignment sign; the "MA" is the API , for example, in the first line, calling MA (the moving average) needs to pass in two parameters. You can think the setting as the incoming parameter, that is, when calling MA , you need to set the type of MA ; the " AND " " OR " are logical operators that are mainly used to connect multiple logical calculations and so on. With the above basic knowledge concept, let's start to learn the detailed M language knowledge.
Basic data
The basic data (opening price, highest price, lowest price, closing price, volume) is an indispensable part of the quantitative trading. To obtain the latest basic data in the strategy, you only need to call the API of the FMZ Quant. If you want to get the basic data of historical price, you can use " REF ", such as: REF (CLOSE, 1) is to get yesterday's closing price.
Variable
Variables can be changed. The name of a variable can be understood as a code name. Its name is supported by English letters, numbers, and lines. However, the length must be controlled within 31 characters. Variable names cannot be repeated with another one, cannot be duplicated with parameter names, cannot be repeated with function names ( APIs ), and each statement should end with a semicolon. Writing comments after the " // " . As shown below:
            INT:=2; //Integer type
FLOAT:=3.1; //Floating point
ISTRUE:=CLOSE>OPEN; //Boolean type
Variable assignment
The variable assignment means that the value to the right of the assignment sign is given to the variable on the left. There are four types of assignments, which can control whether the value is displayed on the chart or the position of the display. They are " : ", " := ", " ^^ ", " .. ", and the code comments at below explain their meaning in detail.
            CC1: C; //Assign the closing price to the variable CC1 and display it in the sub-chart
CC2:=C; //Assign the closing price to variable CC2, but not display in the status bar and chart
CC3^^C; //Assign the closing price to the variable CC3 and display it in the main chart
CC4..0; //Assign the closing price to the variable CC4 and display it in the status bar, but not in the chart
Type of data
There are several data types in the M language, the most common of which are numeric types, string types, and boolean types. The numeric type are numbers, including integers, decimals, positive and negative numbers, etc., such as: 1 , 2 , 3 , 1.1234 , 2.23456 ...; string type can be understood as text, Chinese, English, numbers also can be strings, such as : 'the FMZ Quant', 'CLOSEPRICE', '6000', the string type must be wrapped with double quotes; Boolean type is the simplest, it only has two values of "yes" and "No", such as: 1 with representatives true means "yes" and 0 for false indicates "no."
Relational operator
Relational operators, as the name suggests, are operators used to compare the relationship of two values. They are equal to, greater than, less than, greater than or equal to, less than or equal to, not equal to, as shown below:
            CLOSE = OPEN; //when closing price equals to opening price, return 1 (true), otherwise return 0 (false)
CLOSE > OPEN; //when closing price greater than opening price, return 1 (true), otherwise return 0 (false)
CLOSE < OPEN; //when closing price less than opening price, return 1 (true), otherwise return 0 (false)
CLOSE >= OPEN; //when closing price greater than or equal to opening price, return 1 (true), otherwise return 0 (false)
CLOSE <= OPEN; //when closing price less than or equal to opening price, return 1 (true), otherwise return 0 (false)
CLOSE <> OPEN; //when closing price is not equal to opening price, return 1 (true), otherwise return 0 (false)
Logical Operators
Logical operations can join separate Boolean type statements into the whole, the most common being used are " AND " and " OR ". Suppose there are two Boolean type values, "Closing price is greater than opening price" and "Closing price is greater than moving average", we can group them into a Boolean value, for example: "The closing price is greater than the opening price and ( AND ) closing price is greater than the moving average "," the closing price is greater than the opening price or ( OR ) closing price is greater than the moving average."
            AA:=2>1; //return true
BB:=4>3; //return true
CC:=6>5; //return true
DD:=1>2; //return false
Please pays attention:
-
" AND " is when all conditions are “true” and the final condition is “true”;
-
" OR " means in all conditions, as long as any of the conditions is "true", the final condition is "true".
-
" AND " can be written as " && ", and " OR " can be written as " || ".
Arithmetic operator
There is no difference between the arithmetic operators (" + ”, " - ”, " * ”, " / ”) used in M languages and the mathematics of regular school learning, as shown below:
            AA:=1+1; //the result is 2
BB:=2-1; //the result is 1
CC:=2*1; //the result is 2
DD:=2/1; //the result is 2
Priority
If there is a 100*(10-1)/(10+5) expression, which step is the program first calculated? Middle school mathematics tells us:
1, If it is the same level of operation, it is generally calculated from left to right.
2, If there are additions and subtractions, and multiplication and division , first calculate the multiplication and division, then additions and subtractions.
3, If there are brackets, first calculate the inside of the brackets.
4, If the law of easy-operation is met, the law can be used for the calculation.
The same is true for the M language, as shown below:
            100*(10-1)/(10+5)  //the result is 60
1>2 AND (2>3 OR 3<5)  //the result is false
1>2 AND 2>3 OR 3<5  //the result is true
Execution Mode
In the M language of the FMZ Quant tool, there are two modes of program execution, namely, the closing price mode and the real-time price mode. The closing price mode means that when the current K-line signal is established, placing order on the next K-line. the real-time mode is executing immediately when the current k-line signal is established.
Intraday strategy
If it is an intraday trading strategy, you need to use the " TIME " time function when you need to close the position in the end. This function is above second cycle and below day cycle, shown in the form of four digits : HHMM (1450 - 14 : 50). Note: Using the TIME function as a condition for closing position at the end of the session, it is recommended that the opening position conditions be subject to the corresponding time limit. As shown below:
            CLOSE>OPEN && TIME<1450,BK; //if it is a positive k-line and the time is less than 14:50, opening position.
TIME>=1450,CLOSEOUT; //if the time is beyond 14:50, closing all position.
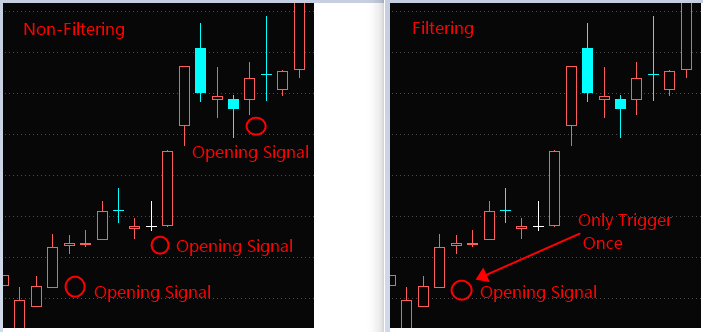
Model classification
There are two types of model classification in the M language: non-filtering model and filtering model. This is actually very well understood: the non-filtering model allows for continuous opening or closing signals, which can be used to add and reduce positions. The filtering model does not allow continuous opening or closing signals, that is, when the opening signal appears, the subsequent opening signal will be filtered until the closing signal appears. The order of the non-filtering model is: open position - close position - open position - close position - open position...
To sum up
The above is the content of the quick start of the M language, now you can program your own trading strategy now. If you need to write a more complex one, you can refer to the FMZ Quant platform's M language API documentation, or directly consult the official customer service to write it for you
Next section notice
Intraday trading is also a popular trading mode. This method does not holding position overnight. Therefore, it is subject to low risk of market volatility. Once unfavorable market conditions occur, it can be adjusted in time. In the next section, we will bring you to write a feasible intraday trading strategy.
After-school exercises
- Try to use the FMZ Quant tool to get the basic date from API by M language.
- How many display methods for variable assignment in the chart?
- 1