
Summary
In the previous article, we explained the premise of realizing the trading strategy from the aspects of the introduction of the M language , the basic grammar, the model execution method, and the model classification. In this article, we will continue the previous part, from the commonly used strategy modules and technologies. Indicators, step by step to help you achieve a viable intraday quantitative trading strategy.
Strategy Module

Think about it, how do you build a robot with Lego pieces? You can not always from top to bottom or from bottom to top, put together piece by piece. People with a little common sense know that they should put their heads, arms, legs, wings, etc. together, and then combine them into a complete robot. The same is true for writing programs, writing the required functions into single strategy module, and then combining these individual strategy modules into a complete trading strategy. Below I will list some common strategy modules:
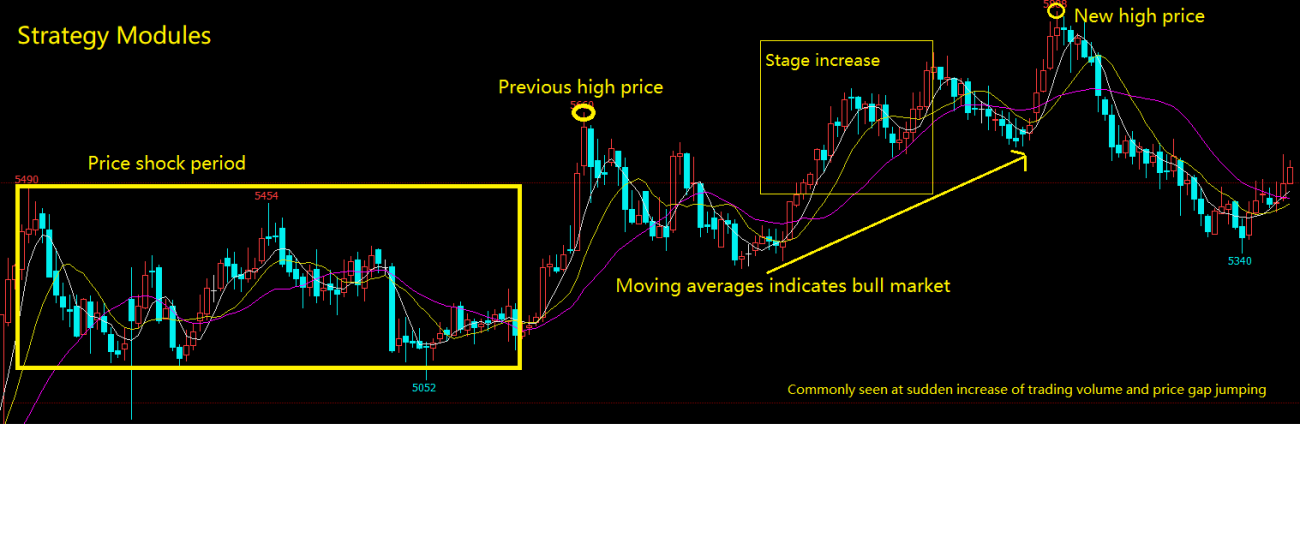
Stage Increase
Stage increase is calculating the percentage of current K line's closing price compare with previous N periods of closing price's difference. For example: Computing the latest 10 K-lines stage increases, can be written:
CLOSE_0:=CLOSE; //get the current K-line's closing price, and save the results to variable CLOSE_0.
CLOSE_10:=REF(CLOSE,10); //get the pervious 10 K-lines' closing price, and save the results to variable CLOSE_10
(CLOSE_0-CLOSE_10)/CLOSE_10*100;//calculating the percentage of current K line's closing price compare with previous N periods of closing price's difference.
New high price
The new high price is calculated by whether the current K line is greater than N cycles' highest price. For example: calculating whether the current K line is greater than the latest 10 K-lines' highest price, can be written:
            HHV_10:=HHV(HIGH,10); //Get the highest price of latest 10 K-lines, which includes the current K-line.
HIGH>REF(HHV_10,1); //Judge whether the current K-line's highest price is greater than pervious K-lines' HHV_10 value.
Price raise with massive trading volume increase
For example: If the current K line's closing price is 1.5 times of the closing price of the previous 10 K-lines, which means in 10 days, the price has risen 50%; and the trading volume also increased more than 5 times of the pervious 10 K-lines. can be written:
            CLOSE_10:=REF(CLOSE,10); //get the 10th K-line closing price
IS_CLOSE:=CLOSE/CLOSE_10>1.5; //Judging whether the current K Line closing price is 1.5 times greater than the value of CLOSE_10

VOL_MA_10:=MA(VOL,10); //get the latest 10 K-lines' average trading volume
IS_VOL:=VOL>VOL_MA_10*5; //Judging whether the current K-line's trading volume is 5 times greater than the value of VOL_MA_10

IS_CLOSE AND IS_VOL; //Judging whether the condition of IS_CLOSE and IS_VOL are both true.
Price narrow-shock market
Narrow-shock market means that the price is maintained within a certain range in the recent period. For example: If the highest price in 10 cycles minus the lowest price in 10 cycles, the result divided by the current K-line's closing price is less than 0.05. can be written:
            HHV_10:=HHV(CLOSE,10); //Get the highest price in 10 cycles(including current K-line)
LLV_10:=LLV(CLOSE,10); //Get the lowest price in 10 cycles(including current K-line)

(HHV_10-LLV_10)/CLOSE<0.05; //Judging whether the difference between HHV_10 and LLV_10 divided by current k-line's closing price is less than 0.05.
Moving average indicates bull market
Moving Average indicates long and short direction, K line supported by or resisted by 5,10,20,30,60 moving average line, Moving average indicates bull market or bear market. can be written:
            MA_5:=MA(CLOSE,5);  //get the moving average of 5 cycle closing price.
MA_10:=MA(CLOSE,10);//get the moving average of 10 cycle closing price.
MA_20:=MA(CLOSE,20);//get the moving average of 20 cycle closing price.
MA_30:=MA(CLOSE,30);//get the moving average of 30 cycle closing price.

MA_5>MA_10 AND MA_10>MA_20 AND MA_20>MA_30; //determine wether the MA_5 is greater than MA_10, and MA_10 is greater than MA_20, and MA_20 is greater than MA_30.
Previous high price and its locations
To obtain the location of the previous high price and its location, you can use FMZ Quant API directly. can be written:
            HHV_20:=HHV(HIGH,20); //get the highest price of 20 cycle(including current K line)
HHVBARS_20:=HHVBARS(HIGH,20); //get the number of cycles from the highest price in 20 cycles to current K line
HHV_60_40:REF(HHV_20,40); //get the highest price between 60 cycles and 40 cycles.
Price gap jumping
The price gap is the case where the highest and lowest prices of the two K lines are not connected. It consists of two K lines, and the price gap is the reference price of the support and pressure points in the future price movement. When a price gap occurs, it can be assumed that an acceleration along the trend with original direction has begun. can be written:
            HHV_1:=REF(H,1); //get the pervious K line's highest price
LLV_1:=REF(L,1); //get the pervious K line's lowest price
HH:=L>HHV_1; //judging wether the current K line's lowest price is greater than pervious K line's highest price (jump up)
LL:=H<LLV_1; //judging wether the current K line's highest price is greater than pervious K line's lowest price (jump down)
HHH:=L/REF(H,1)>1.001; //adding additional condition, the bigger of the price gap, the stronger the signal (jump up)
LLL:=H/REF(L.1)<0.999; //adding additional condition, the bigger of the price gap, the stronger the signal (jump down)
JUMP_UP:HH AND HHH; //judging the overall condition, whether it is a jump up
JUMP_DOWN:LL AND LLL; //judging the overall condition, whether it is a jump down
Common technical indicators
Moving average
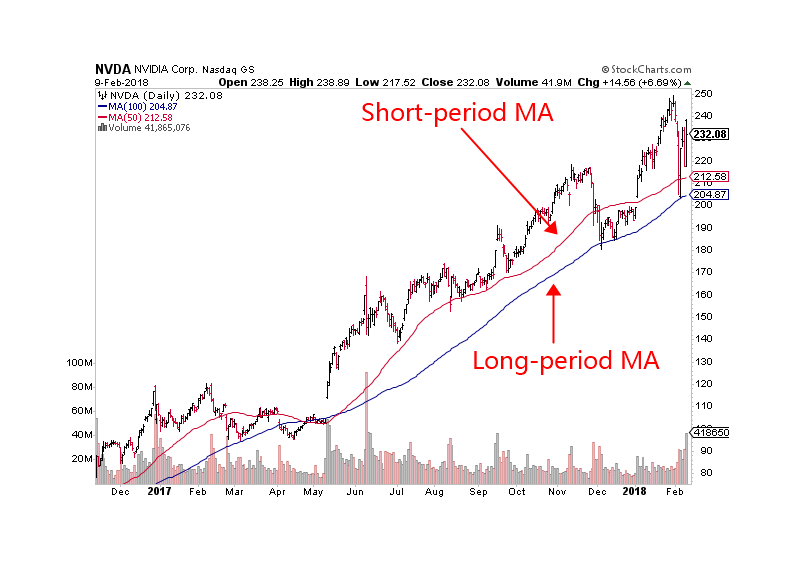
From a statistical point of view, the moving average is the arithmetic average of the daily price, which is a trending price trajectory. The moving average system is a common technical tool used by most analysts. From a technical point of view, it is a factor that affects the psychological price of technical analysts. The decision-making factor of thinking trading is a good reference tool for technical analysts. The FMZ Quant tool supports many different types of moving averages, as shown below:
            MA_DEMO:MA(CLOSE,5);   // get the moving average of 5 cycle
MA_DEMO:EMA(CLOSE,15); // get the smooth moving average of 15 cycle
MA_DEMO:EMA2(CLOSE,10);// get the linear weighted moving average of 10 cycle
MA_DEMO:EMAWH(CLOSE,50); // get the exponentially weighted moving average of 50 cycle
MA_DEMO:DMA(CLOSE,100);  // get the dynamic moving average of 100 cycle
MA_DEMO:SMA(CLOSE,10,3); // get the fixed weight of 3 moving average of closing price in 10 cycle
MA_DEMO:ADMA(CLOSE,9,2,30); // get the fast-line 2 and slow-line 30 Kaufman moving average of closing price in 9 cycle.
Bollinger Bands
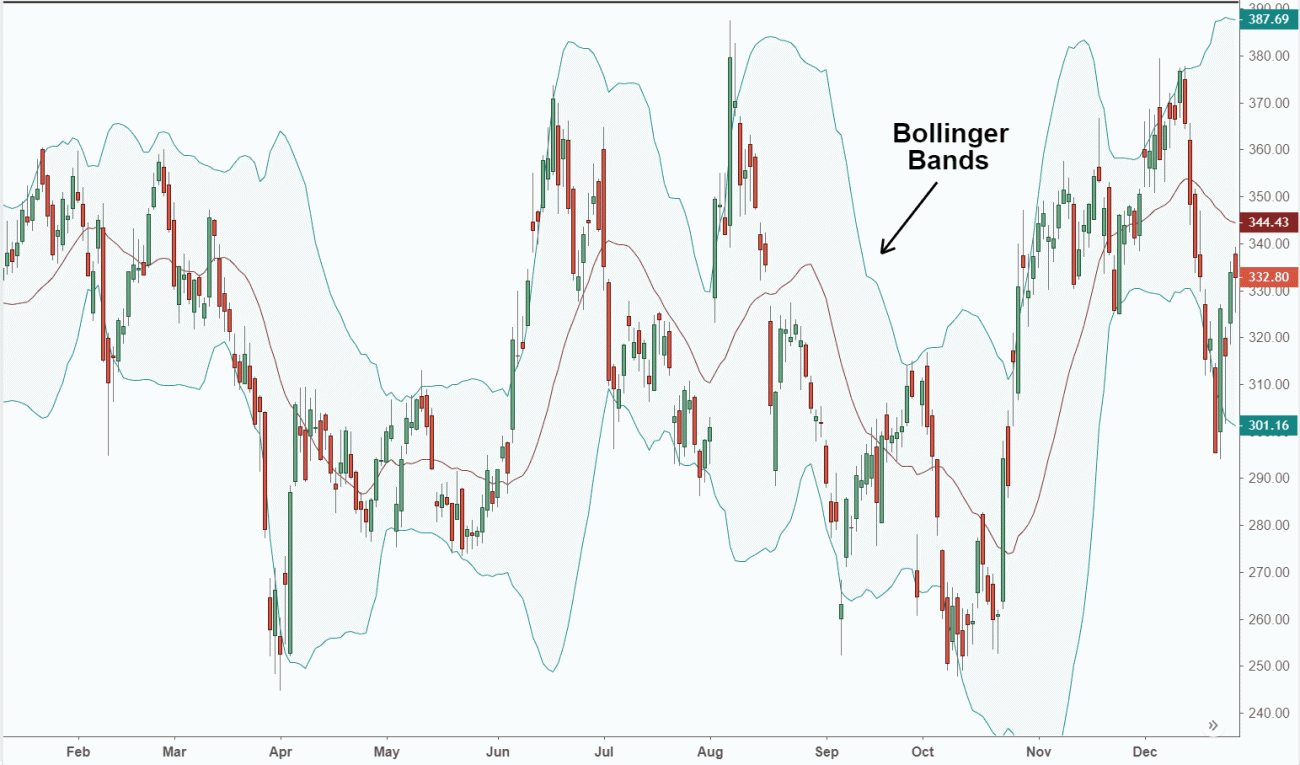
Bollinger bands is also based on the statistical principle. The middle rail is calculated according to the N-day moving average, and the upper and lower rails are calculated according to the standard deviation. When the BOLL channel starts changing from wide to narrow, which means the price will gradually returns to the mean. When the BOLL channel is changing from narrow to wide, it means that the market will start to change. If the price is up cross the upper rail, it means that the buying power is enhanced. If the price down cross the lower rail, it indicates that the selling power is enhanced.
Among all the technical indicators, Bollinger Bands calculation method is one of the most complicated, which introduces the concept of standard deviation in statistics, involving the middle trajectory ( MB ), the upper trajectory ( UP ) and the lower trajectory ( DN ). luckily, you don't have to know the calculation details, you can use it directly on FMZ Quant platform as follows:
            MID:MA(CLOSE,100); //calculating moving average of 100 cycle, call it Bollinger Bands middle trajectory
TMP2:=STD(CLOSE,100); //calculating standard deviation of closing price of 100 cycle.
TOP:MID+2*TMP2; //calculating middle trajectory plus 2 times of standard deviation, call it upper trajectory
BOTTOM:MID-2*TMP2; //calculating middle trajectory plus 2 times of standard deviation, call it lower trajectory
MACD Indicator
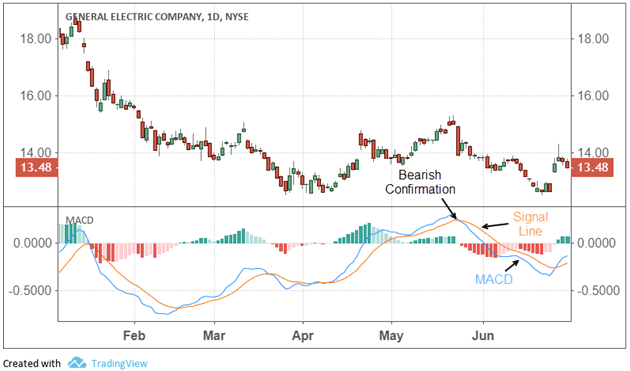
The MACD indicator is a double smoothing operation using fast (short-term) and slow (long-term) moving averages and their aggregation and separation. The MACD developed according to the principle of moving averages removes the defect that the moving average frequently emits false signals, and also retains the effect of the other good aspect. Therefore, the MACD indicator has the trend and stability of the moving average. It was used to study the timing of buying and selling stocks and predicts stock price change. You can use it as follows:
            DIFF:EMA(CLOSE,10)-EMA(CLOSE,50); //First calculating the difference between short-term moving average and long-term moving average.
DEA:EMA(DIFF,10); //Then calculating average of the difference.
The above is the commonly used strategy module in the development of quantitative trading strategies. In addition, there are far more than that. Through the above module examples, you can also implement several trading modules that you use most frequently in subjective trading. The methods are the same. Next, we began to write a viable intraday trading strategy.
Strategy Writing
In the Forex spot market, there is a wellknown strategy called HANS123. Its logic are basically judging wether the price breaks through the highest or lowest price of the number of K lines after the market opening
Strategy logic
-
Ready to enter the market after 30 minutes of opening;
-
Upper rail = 30 minutes high after opening ;
-
Lower rail = 30 minutes low after opening ;
-
When the price breaks above the upper limit, buy and open the position;
-
When the price falls below the lower rail, the seller opens the position.
-
Intraday trading strategy, closing before closing;
Strategy code
            // Data Calculation
Q:=BARSLAST(DATA<>REF(DATA,1))+1; //Calculating the number of period from
the first K line of the current trading day to current k line, and assign the results to N
HH:=VALUEWHEN(TIME=0930,HHV(H,Q)); //when time is 9:30, get the highest price of N cycles, and assign the results to HH
LL:=VALUEWHEN(TIME=0930,LLV(L,Q)); //When time is 9:30, get the lowest price of N cycles, and assign the results to LL

//Placing Orders
TIME>0930 AND TIME<1445 AND C>HH,BK; //If the time is greater than 9:30 and lesser than 14:45, and the closing price is greater than HH, opening long position.
TIME>0930 AND TIME<1445 AND C<LL,SK; //If the time is greater than 9:30 and lesser than 14:45, and the closing price is lesser than LL, opening short position.
TIME>=1445,CLOSEOUT; //If the time is greater or equal to 14:45, close all position.

//Filtering the signals
AUTOFILTER;  //opening the filtering the signals mechanism
To sum up
Above we have learned the concept of the strategy module. Through several commonly used strategy module cases, we had a general idea of the FMZ Quant programming tools, it can be said that learning to write strategy modules and improve programming logic thinking is a key step in advanced quantitative trading. Finally, we used the FMZ Quant tool to implement the trading strategy according a classical Forex trading strategy.
Next section notice
Maybe there are still some confusion for some people, mainly because of the coding part. Don't worry, we have already thought of that for you. On the FMZ Quant platform, there is another even easier programming tool for beginners. It is the visual programming, let's learn it soon!
After-school exercises
-
Try to implement several trading modules that you use most often in subjective trading.
-
Try to implement the KDJ index algorithm using the M language on the FMZ Quant platform.
- 1