
Summary
Many subjective traders are interested in quantitative trading, at first, they begin with full confidence. After learning the basic grammar, data operations, data structure, logic control of traditional programming languages and the lengthy and complicated code, they start to confused. That's why the visual programming language may be more suitable for getting started.
Complete strategy
In order to help you quickly understand the key points of this section, before introducing the FMZ Quant visual programming, let's figure out what is the strategy logic? And have a preliminary understanding of the noun concept in this section. We use the simplest closing price to open long position when it is greater than the 50-period moving average and to open short position when it is less than the 50-period moving average.
-
opening Long position: If there is currently no position, and the closing price is greater than the 50-period moving average.
-
Opening Short position: If there is currently no position, and the closing price is less than the 50-period moving average.
-
Closing Long position: If currently hold long position, and the closing price is less than 50-period moving average.
-
Closing Short position: If currently hold short position, and the closing price is greater than the 50-period moving average.
If you write the above strategy logic in the visual programming, as shown below:
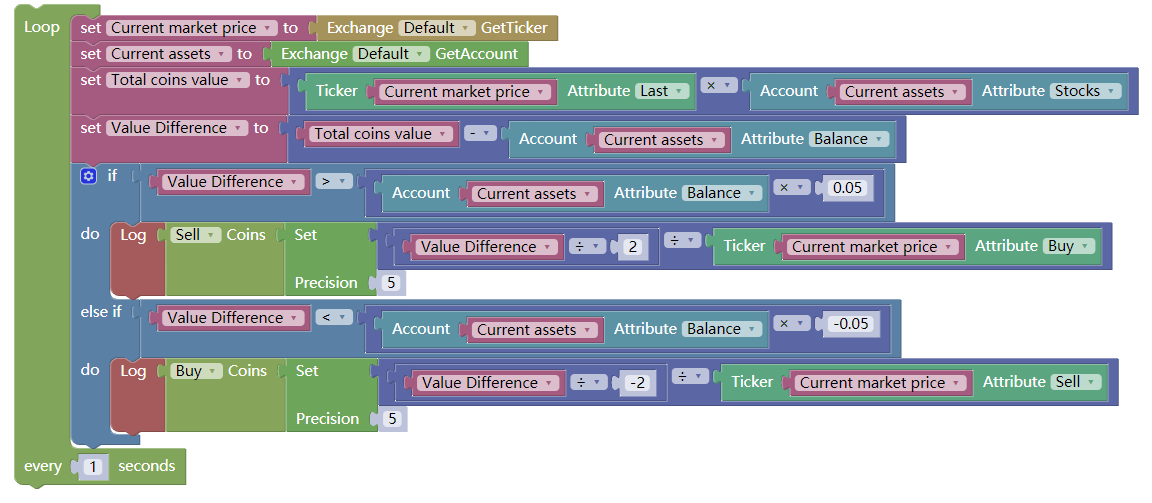
As shown above, the entire design process is : setting market varieties, acquires an array of K-line, acquires pervious K line's 50-period average price, obtain pervious K line's closing price, obtain an array of holding positions, determine the status of holding position, judge wether the closing price it is greater than or less than the moving average, and finally, perform opening or closing position.
Here you need to pay attention to the concept of "array", which is one of the important data structures for every programming language. An array is like a container, which holds a series of values. For example: call the API that gets the K-line array, and the result returned is:
//This is a K-line array. There are 3 data in it: the data of the one before pervious K line, the data of the pervious K line, the data of the current K line, and assigned these values to the "arr" variable.
arr = [{"Time":1540137600000,"Open":4013,"High":4116,"Low":4013,"Close":4085,"Volume":4124040},
{"Time":1540224000000,"Open":4087,"High":4106,"Low":4068,"Close":4076,"Volume":3252216},
{Time":1540310400000,"Open":4064,"High":4123,"Low":4050,"Close":4120,"Volume":3642856}]
The above code is a K-line array of a total of three data, There are 3 data in it: the data of the one before pervious K line, the data of the pervious K line, the data of the current K line, and assigned these values to the "arr" variable. If we want to get the last value of this array (current K line data) we can write it like this (see lines 4 and 5 ):
            //This is a K-line array. There are 3 data in it: the data of the one before pervious K line, the data of the pervious K line, the data of the current K line, and assigned these values to the "arr" variable.

arr = [{"Time":1540137600000,"Open":4013,"High":4116,"Low":4013,"Close":4085,"Volume":4124040},
{"Time":1540224000000,"Open":4087,"High":4106,"Low":4068,"Close":4076,"Volume":3252216},
{Time":1540310400000,"Open":4064,"High":4123,"Low":4050,"Close":4120,"Volume":3642856}]

k0_1 = arr[2]; // get the data of current k line, this is the first method
k0_2 = arr[arr.length - 1]; // get the data of current k line, this is the second method
k1 = arr[arr.length - 2]; // get the data of pervious k line
we should use the second ( 5th line) method, because there are hundreds of K- line data in reality, and the new K-line is continuously increasing. So you should get the length of the array first, "arr.length" means to get the length of the array, and then subtract 1, which is the latest K line data. If you want to get the data of the pervious K line, subtract 2.
You may find that these data in "{}" with English name are correspond respectively meaning: the time, the opening price, the highest price, the lowest price, closing price, trading volume. If you want to get the closing price of the pervious K line, add "." then follow by the required value. Refer to lines 8~10 in the code below.
            //This is a K-line array. There are 3 data in it: the data of the one before pervious K line, the data of the pervious K line, the data of the current K line, and assigned these values to the "arr" variable.

arr = [{"Time":1540137600000,"Open":4013,"High":4116,"Low":4013,"Close":4085,"Volume":4124040},
{"Time":1540224000000,"Open":4087,"High":4106,"Low":4068,"Close":4076,"Volume":3252216},
{Time":1540310400000,"Open":4064,"High":4123,"Low":4050,"Close":4120,"Volume":3642856}]

k0_1 = arr[2]; // get the data of current k line, this is the first method
k0_2 = arr[arr.length - 1]; // get the data of current k line, this is the second method
k1 = arr[arr.length - 2]; // get the data of pervious k line

k1.Close; // get the pervious k line closing price
k2.Time; // get the pervious k line time
k1.Volume; // get the pervious k line trading volume
Why use a visual programming language?
With these concepts above, let's write an output "hello, world" program with the Java programming language, to feel the traditional programming, as shown below:
            public class HelloWorld {
    public static void main(string[] ages) {
        system.out.println("hello world!");
    }
}
Output just a "hello world!" String program, need five lines of code. I believe that most beginners only know the English word " hello, world! " in brackets, and others are just confused as hell. Therefore, it is better to use visual programming as a starting point.
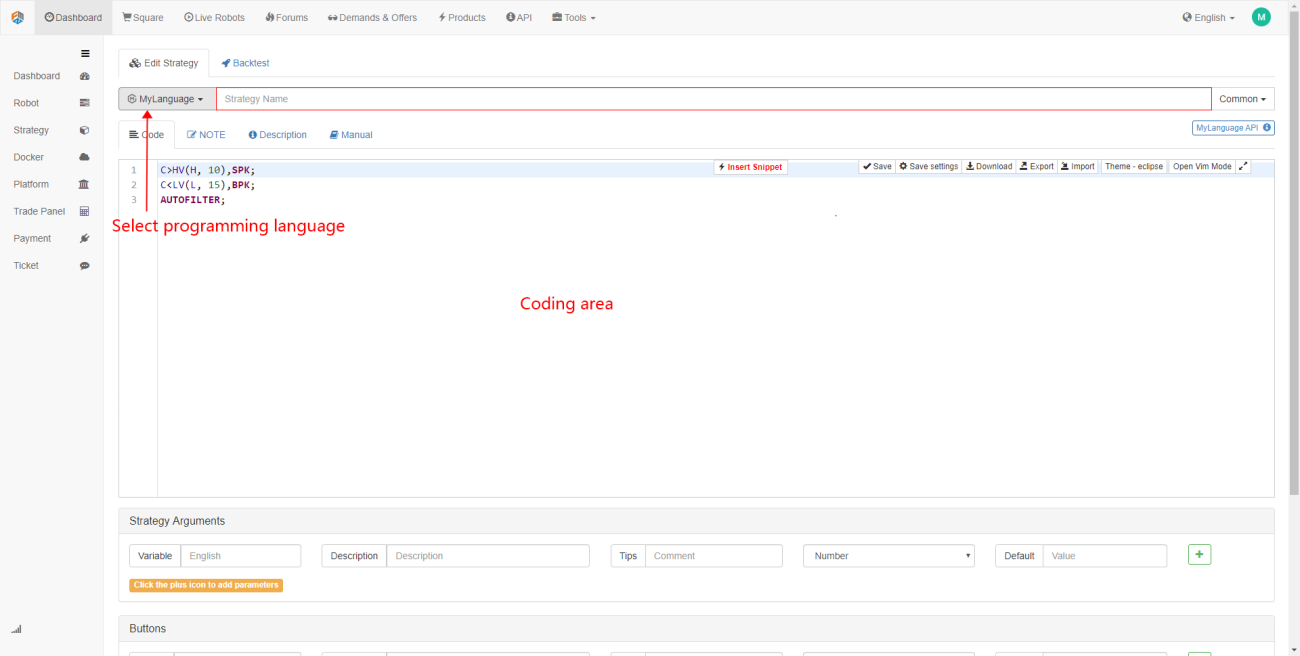
What is visual programming?
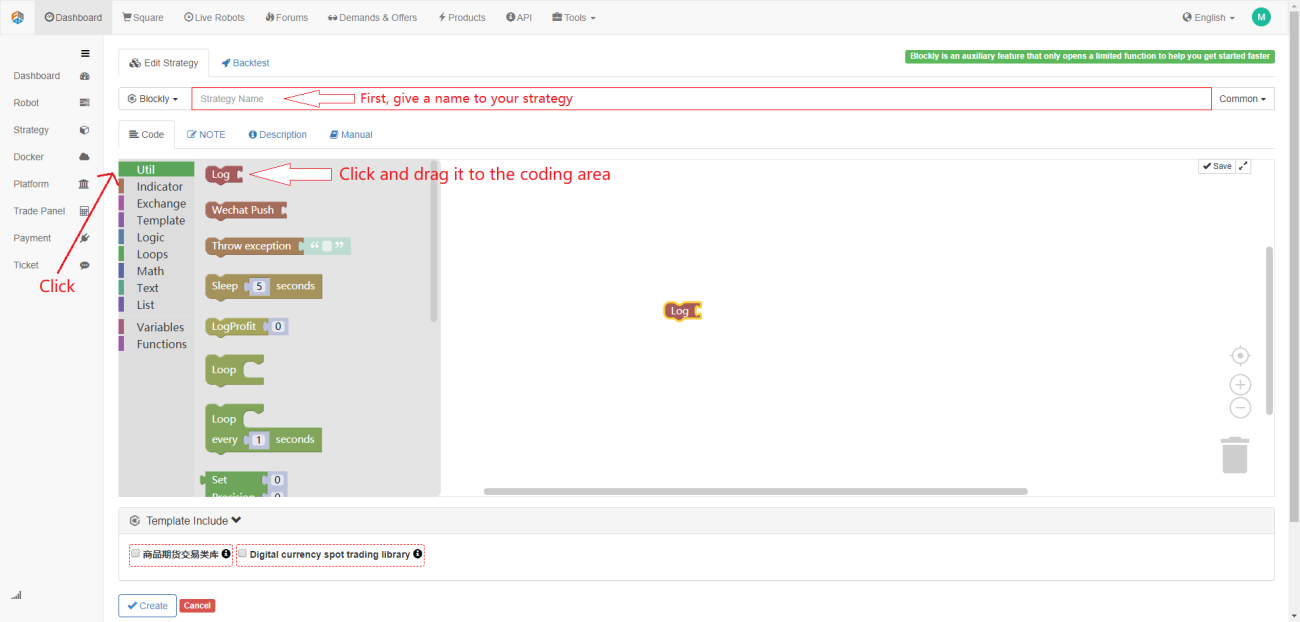
Visual programming has been around for a long time. This kind of "what you see is what you get" programming idea, equipped with a variety of control modules, just by drag and drop, you can build code logic, complete the trading strategy design, the process is like building blocks.
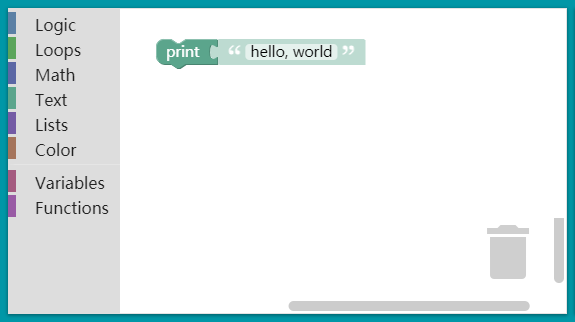
As shown above, the same program, the visual programming requires only one line of "code". This greatly reduces the programming threshold, especially for those who know nothing about programming, this is an excellent operating experience.
What are the characteristics of visual programming languages?
Blockly(the name of this visual programming tool) is not a programming toy, it is like a kind of editor, not the kind of operating system disguised editor, supports many basic elements of programming, such as: variables, functions, arrays, and easy to extend custom blocks, you can use it to complete complex programming tasks. Designed in line with the Unix philosophy: "Do one thing."
The FMZ Quant visual programming tool "Blockly" was published by Google. Similar to the design of "Scratch", which launched by the University of Massachusetts, the real zero threshold for programming (see below).
In the FMZ Quant visual programming interface, there are hundreds of common trading modules built-in, and more trading modules will be added later to support the trader's new ideas and new applications, which will be jointly developed and maintained by the developers.
Although the syntax is simple and does not lose performance. It can satisfy almost all simple quantitative trading strategy development. No matter in function or speed, it is as good as regular programming languages such as Python and JavaScript. in the future, it will support logically complex financial applications.
how to use
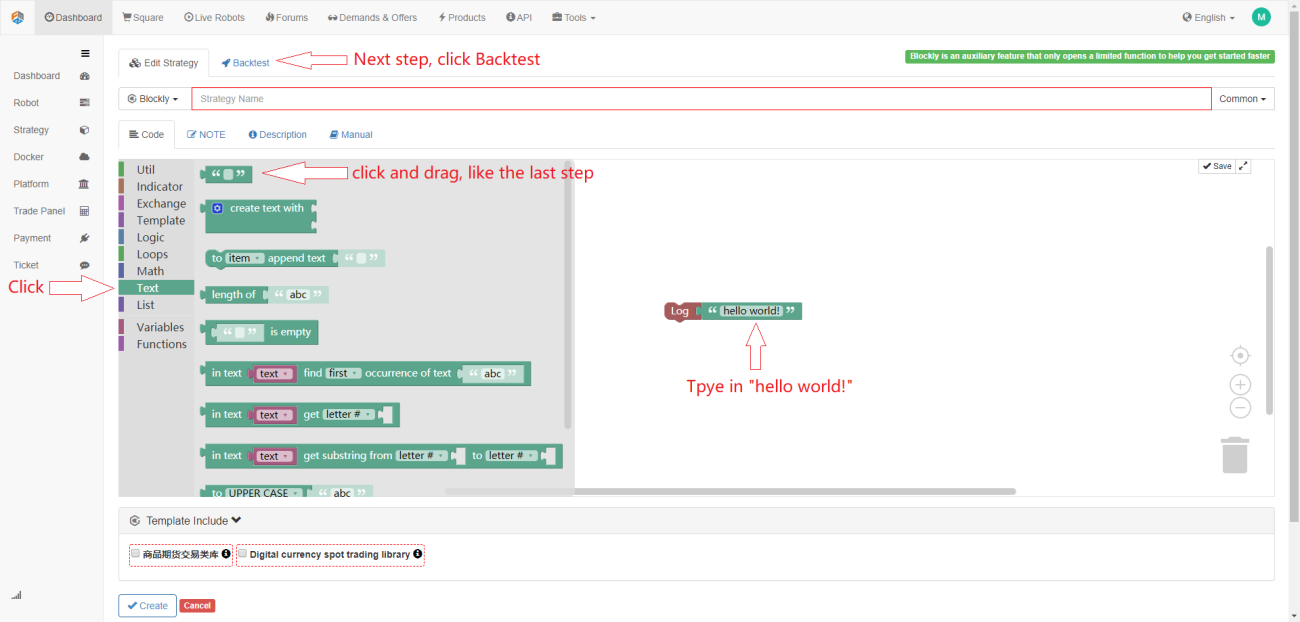
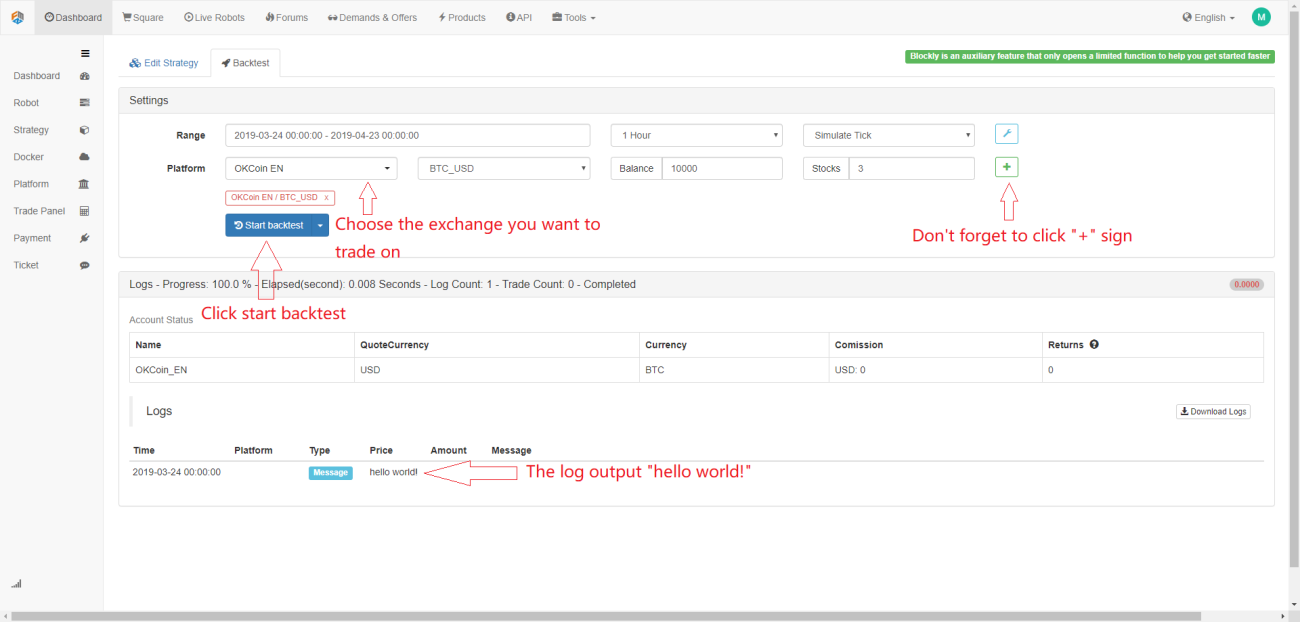
Write a hello, world program
Run, print " hello , world "
To sum up
From the beginning of a complete visual programming strategy, to the introduction and characteristics of the visual programing language, we showed you how to use this tool on the FMZ Quant platform, and wrote an example of " hello world ". However, we need to remind everyone that as an step stone to quantitative trading, it currently has only a limited API interface on the FMZ Quant platform. For quantitative trading, it is better to treat it as a tool, which for helping you to sort out the logic of your strategy.
Next section notice
Visual programming is no different from the basics of high-level programming languages, and even some places are universal. Learning visual programming is a step forward to learning advanced programming. In the next section we will delve into the advanced learning of visual programming, including how to write commonly used quantitative trading modules on the FMZ Quant platform and how to develop a complete intraday trading strategy.
After-school exercises
-
On the FMZ quant platform visual programming interface, use the API and understand what they mean.
-
Get the latest opening price by the visual programming language and output it to the log.
- 1