
Summary
In the previous article, we introduced the fundamental knowledge that when using JavaScript to write a program, including the basic grammar and materials. In this article, we will use it with some common strategy modules and technical indicators to achieve a viable intraday quantitative trading strategy.
Strategy introduction
The Bollinger Band is one of the most commonly used technical indicators, invented by John Bollinger in the 1980s. In theory, prices always fluctuate around a certain range of values. The Bollinger Band is based on this theoretical basis and introduces the concept of “price channel”.
The calculation method is to use the statistical principle, first calculate the "standard deviation" of the price for a period of time, and then add or subtract 2 times the standard deviation of the moving average to find the "trusted interval" of the price. The basic type is a strip channel consisting of three rail lines (middle rail, upper rail, lower rail). The middle rail is the average price, and the upper rail and the lower rail represent the pressure line and the support line of the price, respectively. As shown below:
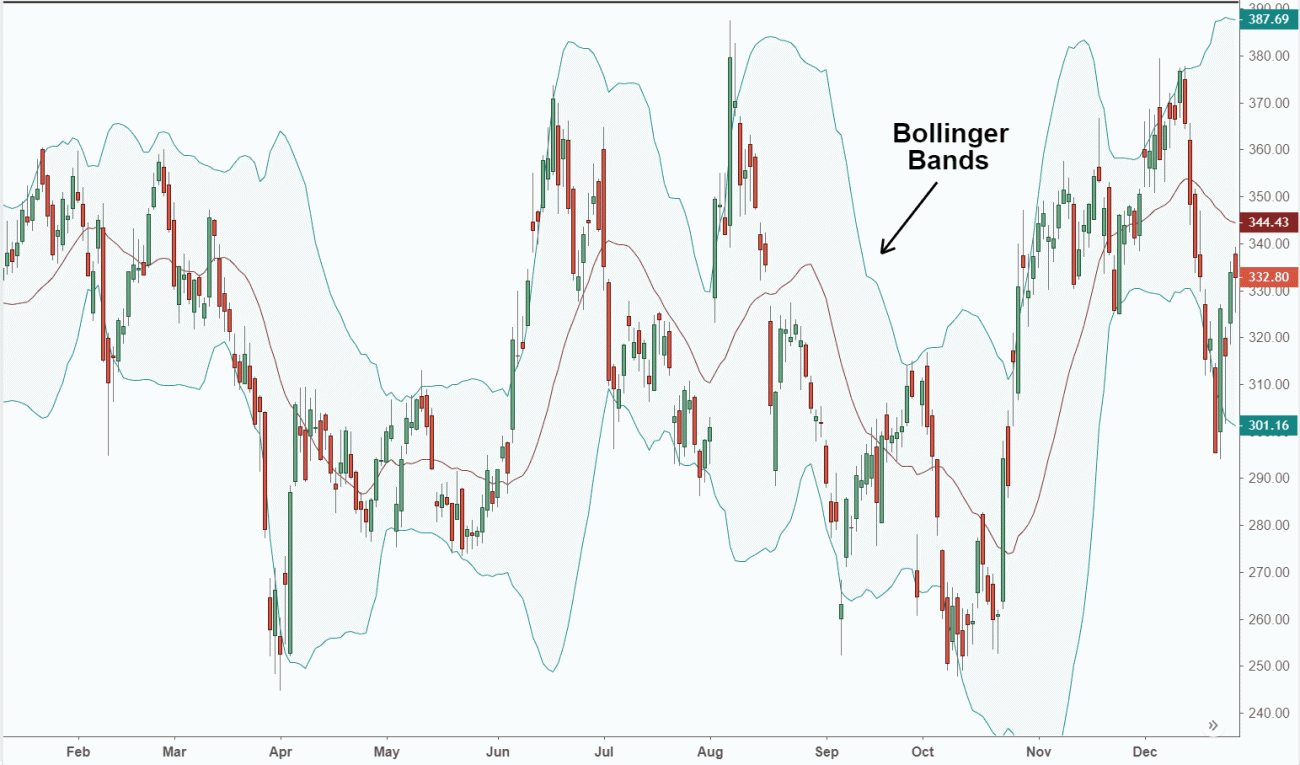
Due to the concept of standard deviation, the width of the Bollinger Band is dynamically adjusted based on recent price fluctuations. When the fluctuations are small, the Bollinger Bands will be narrower; otherwise the fluctuations will be larger and the Bollinger Bands will be wider. When the BOLL channel is changing from narrow to wide, the price gradually returns to the mean. When the BOLL channel is changing from wide to narrow, it means that the market price starts to change. If the price up cross the upper-rail, it means that the buying power is enhanced. If the price goes down cross the lower-rail, it indicates that the selling power is enhanced.
Bollinger Band Indicator Calculation Method
Among all the technical indicators, the Bollinger Band calculation method is one of the most complicated, which introduces the concept of standard deviation in statistics, involving the middle trajectory ( MB ), the upper trajectory ( UP ) and the lower trajectory ( DN ) calculation. Its calculation method is as follows:
-
Middle rail = simple moving average of N time period
-
Upper rail = middle rail + standard deviation of the K × N time period
-
Lower rail = middle rail − standard deviation of the K × N time period
function main( ) { // program entry
while (true) { // enter the loop
exchange.SetContactType('this_week'); // set contact type
var records = exchange.GetRecods(); // get the k line array
var boll = TA.B0LL(records, 50); // get the 50-cycle BOLL indicator array
var top = boll[0]; // get the upper-rail BOLL indicator array
var ma = boll[l]; // get the middle-rail BOLL indicator array
var bottom = boll[2]; // get the lower-rail BOLL indicator array
Log(top); // print the upper-rail BOLL indicator array to the log
Log(ma); // print the middle-rail BOLL indicator array to the log
Log(bottom);// print the lower-rail BOLL indicator array to the log
}
}
Strategy logic
The Bollinger Bands are used in a variety of ways and can be used alone or in combination with other indicators. In this section of the tutorial we will use it the easiest way, which is : When the price breaks through the upper rail, open long position; when the price breaks through the lower rail, open short position.
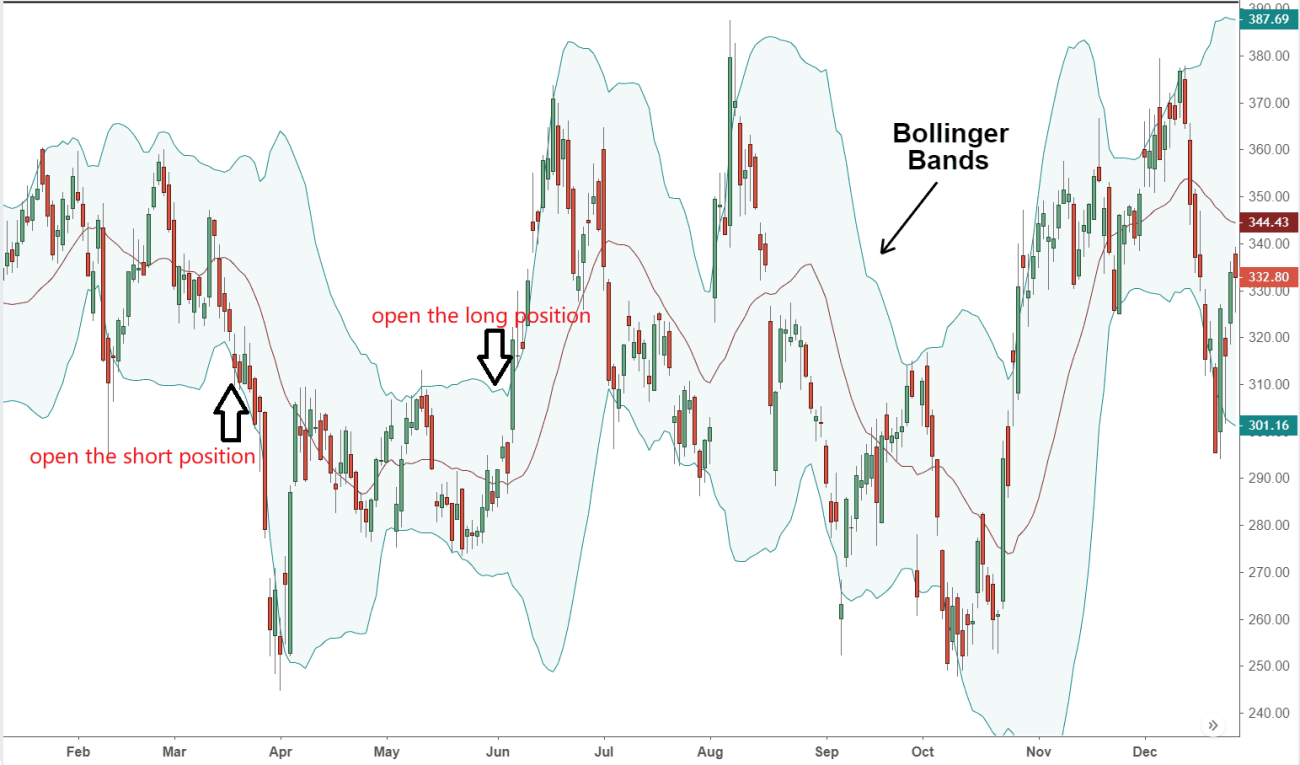
If the price is again returned to the middle-rail of the Bollinger Band after opening the long position, we believe that the strength of the buying power is weakening, or the strength of the selling power is strengthening, therefore, this is where the closing position signal comes in. the same logic for short position.
Trading conditions
-
Long position open: If there is no position, and the closing price is greater than the upper rail.
-
Short position: If there is no position, and the closing price is lower than the lower rail.
-
Close Long position: If holding long position, and the closing price is less than the middle rail,
-
Close Short position: If holding short position, and the closing price is greater than the middle rail,
Strategy code implementation
To achieve the strategy, first we need to consider what data do we need? through which API to get? Then how to calculate trading logic? Finally, which way to place the order? let's implement it step by step:
Step 1: Use the CTA Strategy Framework
The so-called CTA Strategy framework is a set of standard frameworks that the FMZ Quant officially designed. By using this framework, you can ignore the trivial programming problem and focus directly on the logic of programming. For example, if you don't use this framework, you will need to consider shifting the order price, order type, withdrawing orders and so on.
            function main() {
    $.CTA("this_week", function(st) {
        // write your strategy here
    })
}
The above is the CTA strategy framework using the FMZ Quant tool. It is a fixed code format, and all trading logic code is starting from line 3. In addition to the need to modify the variety code in use, no other changes are required elsewhere.
Note that the above trading variety code is "this_week" meaning it represents using the weekly k-line, trading data using the weekly data.
Step 2: Get all kinds of data
Think about it, what kinds of data do we need? From our strategy trading logic, we first need to obtain the current position status, and then compare the closing price with the Bollinger Band indicator upper, middle and lower rails.
- Get K line data
The first is to get the K-line data array and the previous K-line closing price, with the K-line array, we can calculate the Bollinger Band indicator. it can be written like this:
            function main() {
    $.CTA("this_week", function(st) {

        var r = st.records; // get the k line data
        if (r.length < 20) return; // filter the length of k line data
        var close = r[r.length - 2].Close; // get the previous k line closing price

    })
}
As shown above:
Line 4 : Get the K line array, which is a fixed format.
Line 5 : Filter the length of the K line, because the parameter for calculating the Bollinger Band indicator is 20, when the K line is less than 20, it is impossible to calculate the Bollinger Band indicator. So here we need to filter the length of the K line. If the K line is less than 20 , it will return directly and continue to wait for the next K line.
Line 6 : From the obtained K-line array, first obtain the object of the previous K-line, and then obtain the closing price from this object. Obtaining the penultimate element in this array, which is the length of this array minus 2(r[r.length - 2]).
The K-line array elements are all objects, the object contains the opening, highest, lowest and closing price; also the trading volume and time.
For example, to get the closing price, just add " . " follow by the attribute name (r[r.length - 2].Close).
- Get K line time data
Because this is an intraday strategy, we need to close all position before some certain time(most crypto trading exchanges usually open 24/7), so we must judge whether the current K line is close to that certain time when we what to stop trading or take a break. If it is near that closing time K line, close all position. If it is not, continue the strategy. The code is written like this:
            function main() {
    $.CTA("this_week", function(st) {

        var r = st.records; // get the k line data
        if (r.length < 20) return; // filter the length of k line data
        var close = r[r.length - 2].Close; // get the previous k line closing price

        var time = new Date(r[r.length - 1].Time); // according the current k-line timestamp, create a time object
        var isClose = time.getHours() == 14 && time.getMinutes() == 45; // judging whether the current k-line is 14:45. this is just a example, you can specify any time you want during the 24 hours
    })
}
As shown above:
Line 8: get the K line timestamp attribute objects and then create a time object(new Date (timestamp)).
Line 9: Calculate the hours and minutes according to the time object, and determine if the time of the current K line is 14:45 .
- Get position data
Position information is a very important condition in the quantitative trading strategy. When the trading conditions are established, it is necessary to judge whether to place an order by the position status and the number of positions. For example, when the conditions for opening long positions are established, if there are holding position, do not place order; if there are no position holding, place the order. like this:
            function main() {
    $.CTA("this_week", function(st) {

        var r = st.records; // get the k line data
        if (r.length < 20) return; // filter the length of k line data
        var close = r[r.length - 2].Close; // get the previous k line closing price

        var time = new Date(r[r.length - 1].Time); // according the current k-line timestamp, create a time object
        var isClose = time.getHours() == 14 && time.getMinutes() == 45; // judging whether the current k-line is 14:45. this is just a example, you can specify any time you want during the 24 hours

        var mp = st.position.amount; // get the holding position information

    })
}
As shown above:
Line 11: Get the current position status. If there are long position, the value is 1; if there are short position, the value is -1; if there are no position, the value is 0.
- Get Bollinger Band data
Next we need to calculate the values of the upper, middle and lower rails of the Bollinger Band indicator. we need to get the Boolean array first, and then get the values of the upper, middle, and lower rails from this array. In the FMZ quant tool, it is very simple to get the Boolean array, just call the Bollinger Band API directly, it is a two-dimensional array.
it is easy to understand the two-dimensional array, which is the array in a array. The order to obtain the value is: first obtain the specified array in the array, and then obtain the specified element from the specified array, as shown below:
            var arr = [[100, 200, 300],[10,20,30],[1,2,3]]; // this is a two-dimensional array
var test = arr[0]; //first obtain the specified array in the array and assign the value to variable "test"
var demo1 = test[0]; //then get a value from the test array
demo1; // the result is : 100

var demo2 = arr[0][0]; // you also can write like this
demo2; // the result is the same : 100
Below, from 13th to 19th lines are getting the Bollinger Band upper, middle and lower rail coding part, Wherein the line 13 is used the FMZ Quant API tool, which can accessing the Bollinger band array directly; line 14 to line 16 are obtaining the two-dimensional array respectively for the upper, middle and lower rail array; line 17 to line 19 are getting the specify value from the upper, middle, and lower rail array.
            function main() {
    $.CTA("this_week", function(st) {

        var r = st.records; // get the k line data
        if (r.length < 20) return; // filter the length of k line data
        var close = r[r.length - 2].Close; // get the previous k line closing price

        var time = new Date(r[r.length - 1].Time); // according the current k-line timestamp, create a time object
        var isClose = time.getHours() == 14 && time.getMinutes() == 45; // judging whether the current k-line is 14:45. this is just a example, you can specify any time you want during the 24 hours

        var mp = st.position.amount; // get the holding position information

        var boll = TA.BOLL(r, 20, 2); //calucating the Bollinger Band indicator
        var upLine = boll[0]; // get the up-rail array
        var midLine = boll[1]; // get the middle-rail array
        var downLine = boll[2]; // get the lower-rail array
        var upPrice = upLine[upLine.length - 2];  // get the previous K-line upper rail value
        var midPrice = midLine[midLine.length -2]; // get the previous K-line middle rail value
        var downPrice = downLine[downLine.length -2]; // get the previous K-line lower rail value

    })
}
Step 3: placing order and trade
With the above data, we can write the trading logic and placing order part now. It is also very simple, the most commonly used is the "if statement", which can be described as: if condition 1 and condition 2 are true, place the order; if condition 3 or condition 4 is are true, place the order. As shown below:
            function main() {
    $.CTA("this_week", function(st) {

        var r = st.records; // get the k line data
        if (r.length < 20) return; // filter the length of k line data
        var close = r[r.length - 2].Close; // get the previous k line closing price

        var time = new Date(r[r.length - 1].Time); // according the current k-line timestamp, create a time object
        var isClose = time.getHours() == 14 && time.getMinutes() == 45; // judging whether the current k-line is 14:45. this is just a example, you can specify any time you want during the 24 hours

        var mp = st.position.amount; // get the holding position information

        var boll = TA.BOLL(r, 20, 2); //calucating the Bollinger Band indicator
        var upLine = boll[0]; // get the up-rail array
        var midLine = boll[1]; // get the middle-rail array
        var downLine = boll[2]; // get the lower-rail array
        var upPrice = upLine[upLine.length - 2]; // get the previous K-line upper rail value
        var midPrice = midLine[midLine.length -2]; // get the previous K-line middle rail value
        var downPrice = downLine[downLine.length -2]; // get the previous K-line lower rail value

        if (mp == 1 && (close < midPrice || isClose)) return -1; // if holding long position, and the closing price is less than the mid-rail, or the current time is 14:45, closing long position.
        if (mp == -1 && (close > midPrice || isClose)) return 1; // if holding short position, and the closing price is greater than the mid-rail, or the current time is 14:45, closing short position.
        if (mp == 0 && close > upPrice && !isClose) return 1; // if there are no holding position, and the closing price is greater than the upper-rail, or the current time is not 14:45, open long position.
        if (mp == 0 && close < downPrice && !isClose) return -1;// if there are no holding position, and the closing price is less than the lower-rail, or the current time is not 14:45, open short position.

    })
}
In the above figure, lines 21 to 24 are the trading logic and placing order coding part. From top to bottom they are: closing long position, closing short position, open long position and open short position.
Take the open long position as an example. This is an "if statement". If only one line of code is executed in this statement, the curly braces " {} " can be omitted. The statement is translated into text meaning: if the current position is 0 and the closing price is greater than the upper rail, and the k-line time is not 14:45, then " return 1 "
you may find that these lines have " return 1 " and " return -1 ", which is a fixed format, meaning: if it is the buying direction, write " return 1 "; if it is the selling direction, write " return -1 ". opening long position and closing short position are all buying direction, so write "return 1"; and vice versa.
Complete Strategy code
At this point, a complete strategy code is written. If the trading framework, trading data, trading logic and placing order are written separately, it is very simple? The following is the entire code of this strategy:
            function main() {
    $.CTA("this_week", function(st) {
        var r = st.records; // get the k line data
        if (r.length < 20) return; // filter the length of k line data
        var close = r[r.length - 2].Close; // get the previous k line closing price
        var time = new Date(r[r.length - 1].Time); // according the current k-line timestamp, create a time object
        var isClose = time.getHours() == 14 && time.getMinutes() == 45; // judging whether the current k-line is 14:45. this is just a example, you can specify any time you want during the 24 hours
        var mp = st.position.amount; // get the holding position information
        var boll = TA.BOLL(r, 20, 2); //calucating the Bollinger Band indicator
        var upLine = boll[0]; // get the up-rail array
        var midLine = boll[1]; // get the middle-rail array
        var downLine = boll[2]; // get the lower-rail array
        var upPrice = upLine[upLine.length - 2]; // get the previous K-line upper rail value
        var midPrice = midLine[midLine.length -2]; // get the previous K-line middle rail value
        var downPrice = downLine[downLine.length -2]; // get the previous K-line lower rail value
        if (mp == 1 && (close < midPrice || isClose)) return -1; // if holding long position, and the closing price is less than the mid-rail, or the current time is 14:45, closing long position.
        if (mp == -1 && (close > midPrice || isClose)) return 1; // if holding short position, and the closing price is greater than the mid-rail, or the current time is 14:45, closing short position.
        if (mp == 0 && close > upPrice && !isClose) return 1; // if there are no holding position, and the closing price is greater than the upper-rail, or the current time is not 14:45, open long position.
        if (mp == 0 && close < downPrice && !isClose) return -1;// if there are no holding position, and the closing price is less than the lower-rail, or the current time is not 14:45, open short position.
    })
}
There are two things need to be notice:
-
Try to (but not necessarily) write the strategy logic as the current K-line condition is established, then placing the order on the next k-line. Or the previous k-line condition is established, placing orders on the current k-line, in this way, the result of the backtest and the real market performance are not much different. It is OK to not write like this, but pay attention to whether the strategy logic is correct.
-
In general, the logic of closing position should write in front of the opening position logic. The purpose of this is to try to make the strategy logic meet your expectations. For example, if the strategy logic just meet the situation where it need to do the opposite direction of trading after just close a position, the rule of this kind of situation is to close the position first and then open the new position. If we write the closing position logic in front of the opening position logic, it will perfectly fullfil this rule.
To sum up
Above we have learned each step of developing a complete intraday quantitative trading strategy, including: strategy introduction, Bollinger indicator calculation method, strategy logic, trading conditions, strategy code implementation, etc. Through this strategy case, not only we familiar with the programming methods of the FMZ Quant tools, but also can build some other strategies that are adapted according to this template.
Quantitative trading strategy is nothing more than a summary of subjective trading experience or system. If we write down the experience or system used in subjective trading before writing the quantitative strategy, and then translate it into code one by one, you will find that the writing a quantitative strategy will be much easier.
Next section notice
In quantitative trading strategy development, if only can choose one programming language, without hesitation, it must be Python. From getting data to backtesting, even the placing order part, Python has covered the entire business chain. In the field of financial quantitative investment, Python has occupied an extremely important position, the next section of the course we will begin to learn the Python language.
After-school exercises
-
Try to use the knowledge in this section to implement a double moving average strategy.
-
Try to implement the KDJ indicator strategy using the JavaScript language on the FMZ Quant platform.
- 1