
Summary
In the previous article, we learned about the introduction to the Python language, the basic syntax, the strategy framework and more. Although the content was boring, but it's a must-required skill in your trading strategy development. In this article, let's continue the path of Python with a simple strategy, step by step to help you achieve a feasible quantitative trading strategy.
Strategy Introduction
Among many trading strategies, Donchian channel strategy should be one of the most classic breakthrough strategies. It has been famous since 1970. At that time, a company specialized in simulation testing and research on mainstream programmatic trading strategies. In all strategy tests, Donchian channel strategy was the most successful.
Later, in United States, the famous "turtle" trader training events happened, which made a great success in the history of securities trading. At that time, the "Turtles" trading method was confidential, but after more than a decade, the "Turtle Trading Law" was made public, and people discovered that the "Turtle Trading" used the improved version of the Donchian channel strategy.
The breakthrough trading strategy is adapted to the relatively smooth trend of trading varieties. The most common way for breakthrough is to use the relative positional relationship between the price support and resistance to determine the specific trading position. The Donchian channel strategy in this section is also based on this principle.
Donchian Channel Strategy Rules
The Donchian channel is a trend-oriented indicator, and its appearance and signal are somewhat similar to the Bollinger Band indicator. However, its price channel is built according to the highest and lowest prices in a certain period. For example: the upper rail is calculated by the most recent 50 k-line's highest price; the lower rail is calculated by the most recent 50 k-line's lowest price.
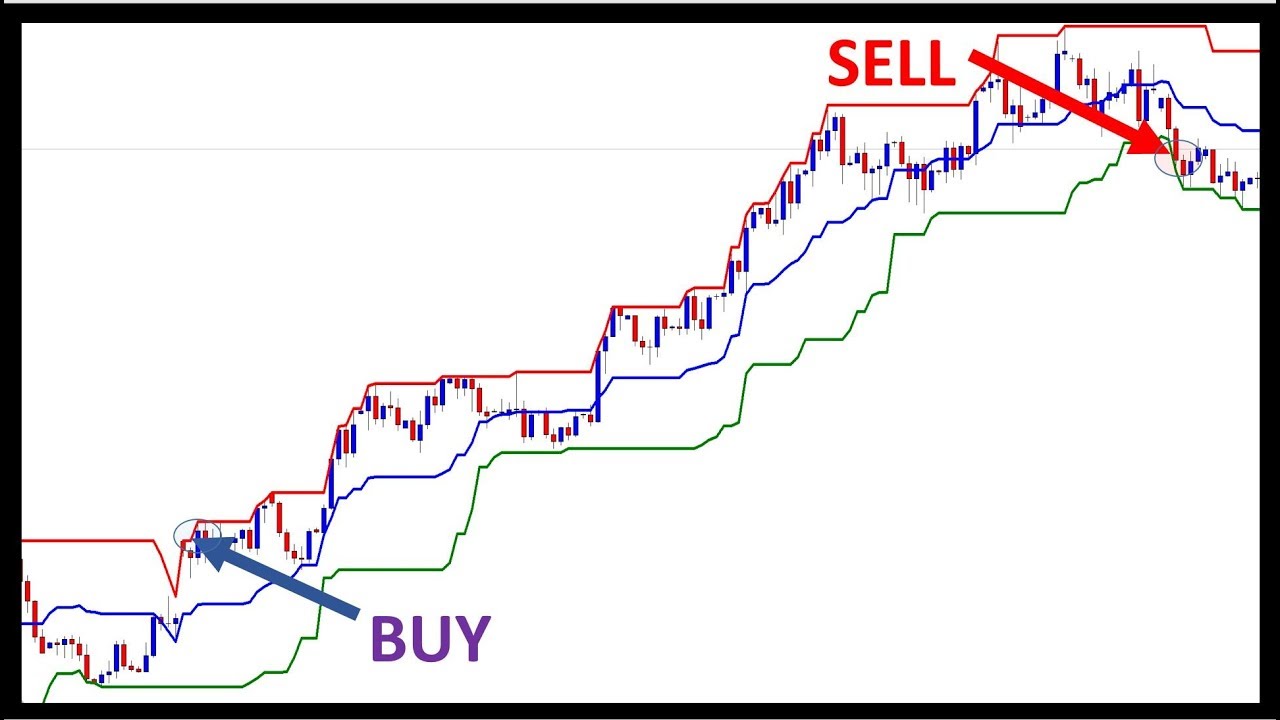
as shown above: this indicator with the curve composed of three different colors, the default setting is the highest and the lowest price in the 20 cycle to display price volatility. It will show less volatility when the price is in a narrow channel, and vice versa.
If prices rise above the upper rail, the buying signal will appear; conversely, if the price fall below the lower rail, the selling signal will appear. Since the upper and lower rails which are calculated by using the lowest and highest price, so under normal circumstances, the price will not breakthrough the rails, it will move along with the rails or jumping around inside the channel.
Donchian channel calculation method
On the FMZ Quant platform, the Donchian channel calculation is simple, you
can just access to the highest or the lowest price in the given cycle, as shown below: the 5th line is to obtain the highest price of 50 cycles, the 6th line is to obtain the lowest price of 50 cycles.
def main(): # program entry
exchange.SetContractType("this_week") # set the variety type by using the weekly k-line
while True: # enter the loop
records = exchange.GetRecords() # get the k line array
upper = TA.Highest(record, 50, 'high') # get the highest price of 50 cycles
lower = TA.Lowest(record, 50, 'low') # get the lowest price of 50 cycles
middle = (upper + lower) / 2 # calculate the average value of upper and lower rails
Log("upper rail: ", upper) # print the upper rail value in the log
Log("lower rail: ", lower) # print the lower rail value in the log
Log("middle rail: ", middle) # print the middle rail value in the log
Strategy Logic
There are many ways to use the Donchian channel, which can be used alone or in combination with other indicators. In this section we will use it by the easiest way. That is: when prices breakthrough the upper rail, which means it breaking above the pressure line, the buying power is strong, it has formed a wave of rising energy, buying signal is generated; when the price breakthrough below the lower rail, which means it breaking below the support line, the selling signal is generated.
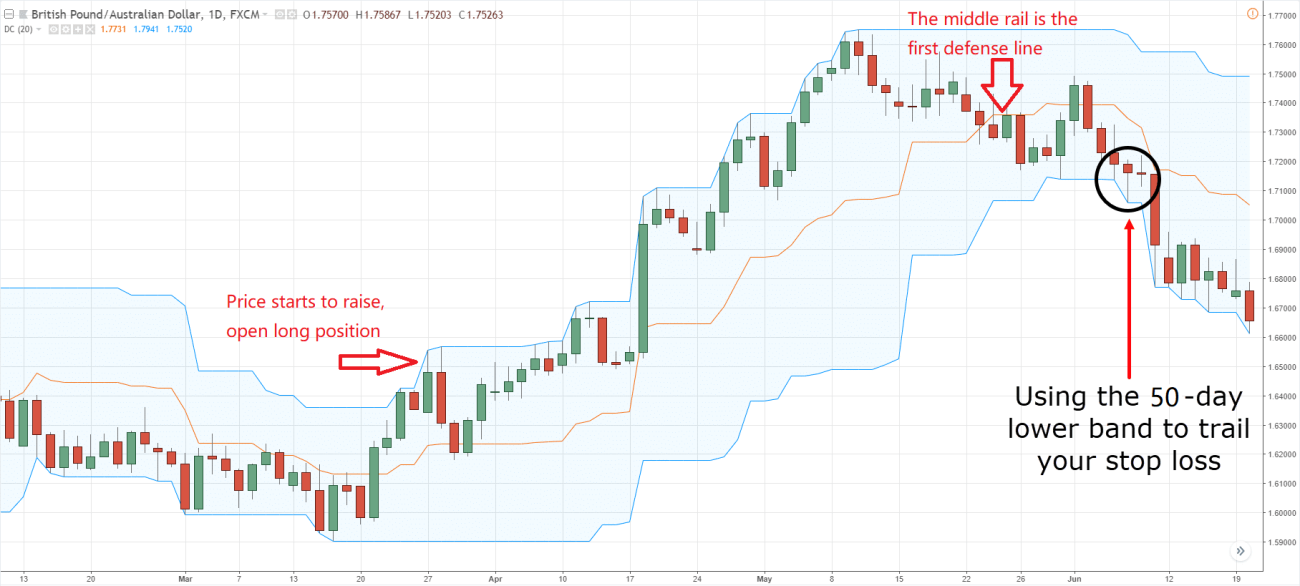
If the price is again dropped back to the middle rail of the channel after the opening of the long position, we believe that the strength of the buying power is weakening, or the strength of the selling power is strengthening, and the signal of opening short position is generated; the same principle apply to the opening short position
Trading Conditions
-
Long position open: If there is no position holding, and the closing price is greater than the upper rail
-
Short position open: If there is no position holding, and the closing price is less than the lower rail
-
Closing long position: If currently holding long position, and the closing price is less than the middle rail
-
Closing short position: If currently holding short position, and the closing price is greater than the middle rail
Strategy Code Implementation
The first step in implementing the strategy is to get the data first, because the data is a prerequisite part of the trading strategy. Think about it, what data do we need? And how to get those data?
Next is to calculate the trading logic based on these data; the final step is to trade according the logic. steps as follows:
Step 1: Using the trading class library
You can think of the trading class library as a functional module. The advantage of using a trading class library is that it allows you to focus on writing strategy logic. For example, when we use the trading class library, in order to open or close a position, we can directly use the API interface in the trading class library; but if we don't use the trading class library, we need to obtain the market price when opening the position. Need to consider the issue of unexecuted orders and the issue of withdrawal orders, and so on.
            def main();
    wile true:
        obj = ext.NewPositionManager() # using the trading class library
        # followed by strategy logic and placing order part
The above coding part is the CTA strategy framework using the FMZ Quant tool . This is a fixed coding format, and all trading logic code will start from line 4. No other changes are required elsewhere.
Step 2: Get all kinds of data
Think about it, what kinds of data do we need? From our strategy trading logic, we first need to obtain the current position status, and then compare the closing price with the Bollinger Band indicator upper, middle and lower rails.
- Get K line data
The first is to get the K-line data array and the current K-line closing price, with the K-line array, we can calculate the N cycle period of the highest and lowest price through the API interface. it can be written like this:
            def main(): # main function
    exchange.SetContractType("this_week") # set the variety type by using the weekly k-line
    while True: # enter the loop
        records = exchange.GetRecords() # get the k line array
        if len(records) < 50: continue # if the number of K line is less than 50, skip this loop.
        close = records[len(records) - 1].Close # get the closing price of the latest k-line
As shown above:
Line 4 : Get the K line array, which is a fixed format.
Line 5: Filter the length of the K line, because the parameter for calculating the Donchian channel indicator is 50, when the number of K line is less than 50, it is impossible to calculate it. So here we need to filter the number of the K line. If the number of K line is less than 50, it will skip the current loop and continue to wait for the next K line.
Line 6 : We use the code " records[ len (records) - 1] " to get the last data of the K- line array, which is the latest K-line data. This data is an object, which contains: the opening price, the highest, lowest and closing price, also the trading volume, time and other data, since it is an object, so we just use ".Close" to get the latest closing price of the K-line.
- Get position data
Position information is a very important condition in the quantitative trading strategy. When the trading conditions are established, it is necessary to judge whether to place an order by the position status and the number of positions. For example, when the conditions for opening long positions are established, if there are holding position, do not place order; if there are no position holding, place the order. This time we directly encapsulate the position information into a function, we can just call this function to use it. like this:
            # get the position information function
def mp():
    positions = exchange.GetPosition() # get the holding position array
    if len(position) == 0: # if the holding position array is 0
        return 0 # meaning currently has no position holding, return 0
    for i in range(len(position)): # Traversing the position array
        if (position[i]['Type'] == PD_LONG):
            return 1 # if there are long position holding, return 1
        elif (position[i]['Type'] == PD_SHORT):
            return -1 # if there are short position holding, return -1

def main(): # main function
    exchange.SetContractType("this_week") # set the variety type by using the weekly k-line
    while True: # enter the loop
        records = exchange.GetRecords() # get the k line array
        if len(records) < 50: continue # if the number of K line is less than 50, skip this loop.
        close = records[len(records) - 1].Close # get the closing price of the latest k-line
        position = mp() # get the position information function
As shown above:
This is a function that gets the position information. If there are long position, the value is 1; if there are short position, the value is -1; if there are no position, the value is 0.
Line 2 : Create a function with the name "mp". This function has no parameters.
Line 3 : Get the position array, which is a fixed format.
Line 4 : Determine the length of the position array. If its length is equal to 0, it means that it has no position holding, returns 0.
Line 6 : Using the for loop, starting to traverse this array, the following logic is very simple, if it's holding long position, returns 1 ; if it's holding short position, returns -1 .
Line 18 : Call the position information function "mp".
- Acquire the highest and lowest price of the most recent 50 K-lines
In the FMZ Quant quantitative trading tool, you can directly use the " TA.Highest " and " TA.Lowest " functions without having to write your own logic calculations. And "TA.Highest" and "TA.Lowest" function returns a result of the specific values instead of an array. This is very convenient. not only that, the FMZ Quant platform has official built-in hundreds of other indicator functions.
            # get the position information function
def mp():
    positions = exchange.GetPosition() # get the holding position array
    if len(position) == 0: # if the holding position array is 0
        return 0 # meaning currently has no position holding, return 0
    for i in range(len(position)): # Traversing the position array
        if (position[i]['Type'] == PD_LONG):
            return 1 # if there are long position holding, return 1
        elif (position[i]['Type'] == PD_SHORT):
            return -1 # if there are short position holding, return -1

def main(): # main function
    exchange.SetContractType("this_week") # set the variety type by using the weekly k-line
    while True: # enter the loop
        records = exchange.GetRecords() # get the k line array
        if len(records) < 50: continue # if the number of K line is less than 50, skip this loop.
        close = records[len(records) - 1].Close # get the closing price of the latest k-line
        position = mp() # get the position information function
        upper = TA.Highest(record, 50, 'High') # get the highest price of 50 cycles
        lower = TA.Lowest(record, 50, 'Low') # get the lowest price of 50 cycles
        middle = (upper + lower) / 2 # calculate the average value of the upper and lower rail
As shown above:
Line 19: call "TA.Highest" function to get the highest price of 50 cycles
Line 20 : call "TA.Lowest" function to get lowest price of 50 cycles
Line 21: calculate the average value of the upper and lower rail according to highest and lowest price of 50 cycles
Step 3: Placing Order and trade
With the above data, we can write the trading logic and placing order part now. It is also very simple, the most commonly used is the "if statement", which can be described as: if condition 1 and condition 2 are true, place the order; if condition 3 or condition 4 is are true, place the order. As shown below:
            # get the position information function
def mp():
    positions = exchange.GetPosition() # get the holding position array
    if len(position) == 0: # if the holding position array is 0
        return 0 # meaning currently has no position holding, return 0
    for i in range(len(position)): # Traversing the position array
        if (position[i]['Type'] == PD_LONG):
            return 1 # if there are long position holding, return 1
        elif (position[i]['Type'] == PD_SHORT):
            return -1 # if there are short position holding, return -1

def main(): # main function
    exchange.SetContractType("this_week") # set the variety type by using the weekly k-line
    while True: # enter the loop
        records = exchange.GetRecords() # get the k line array
        if len(records) < 50: continue # if the number of K line is less than 50, skip this loop.
        close = records[len(records) - 1].Close # get the closing price of the latest k-line
        position = mp() # get the position information function
        upper = TA.Highest(record, 50, 'High') # get the highest price of 50 cycles
        lower = TA.Lowest(record, 50, 'Low') # get the lowest price of 50 cycles
        middle = (upper + lower) / 2 # calculate the average value of the upper and lower rail
        obj = ext.NewPositionManager() # using the trading class library
        if position > 0 and close < middle: # If currently holding long position, and the closing price is less than the middle rail
            obj.CoverAll() # close all position
        if position < 0 and close > middle: # If currently holding short position, and the closing price is greater than the middle rail
            obj.CoverAll() # close all position
        if position == 0: # if currently holding no position
            if close > upper: # if the closing price is greater than the middle rail
                obj.OpenLong("this_week", 1) # open long position
            elif close < lower: # if the closing price is less than the middle rail
                obj.OpenShort("this_week", 1) # open short position
As shown above:
Line 22 : Using the trading class library, this is a fixed format
Lines 23, 24 : This is a closing long position statement that uses the "comparison operators" and "logical operators" we have learned before, meaning that if the current holding is long position, and the closing price is less than the middle rail, close all positions .
Lines 25, 26 : This is a closing short position statement that uses the "comparison operators" and "logical operators" we have learned before, meaning that if the current order is short position and the closing price is greater than the middle rail, close all positions .
Line 27 : Determine the current position status. If there are no position holding, proceed to the next step.
Lines 28, 29 : Determine whether the closing price is greater than the upper rail. If the closing price rises above the upper rail, open long position.
Lines 30, 31 : Determine whether the closing price is less than the lower rail. If the closing price falls below the lower rail, open short position.
To sum up
Above we have learned each step of developing a complete quantitative trading strategy by using Python, including: strategy introduction, Donchian channel calculation method, strategy logic, trading conditions, strategy code implementation, etc. This section is just a simple strategy. As a method of inspiring, there are more than one way to accomplish it. You can superimpose different trading methods according to your trading system to form your own quantitative trading strategy.
Next section notice
In the development of quantitative trading strategies, from the perspective of the speed of programming language execution, which one is the fastest? it must be the C++. Especially in the field of financial derivatives and high-frequency trading. C++ is unique in language specificity and it has advantages in numerical calculations. Compared with JavaScript and Python, its speed can be increased by several orders of magnitude. If you want to go to the field of financial derivatives or high-frequency trading in the future. This will be the course you should not miss.
After-school exercises
-
Start from the basic and implement the strategy of this section.
-
Try to add a moving average indicator to the strategy in this section to reduce the trading frequency.
- 1