
Summary
The significance and importance of backtesting is undoubted. When doing quantitative backtesting, the strategy should be placed in the historical environment as real and close as possible. If some details in the historical environment are ignored, the whole quantitative backtesting may be invalid. This article will explain how to do the appropriate quantitative trading backtesting.
Backtesting is equivalent to data playback. By playing back historical K- line data and performing real-market trading rules, such as the Sharpe ratio, maximum retracement rate, annualized rate of return and capital curves. At present, there are many softwares that can do all these, such as "MetaTrader", "MultiCharts" and "IB Trader Workstation", which are all very comprehensive, also there is a open-sourced one called VNPY on github.com, which can be customized flexibly.
The FMZ Quant as a commercial quantitative trading software, comes with the high performance backtest engine, using for-loop (polling) backtest frame, to quantify the calculation faster. And unified backtesting and real-time code, solved the "backtesting easy, but real-market difficult" dilemma.
FMZ Quant Backtest Interface Introduction
- Step 1
Taking the FMZ Quant “Thermostat” timing strategy as an example, let's open the official website of the FMZ Quant (www.fmz.com). Click dashboard, Strategy, select a strategy, click backtest, and go to the following page:
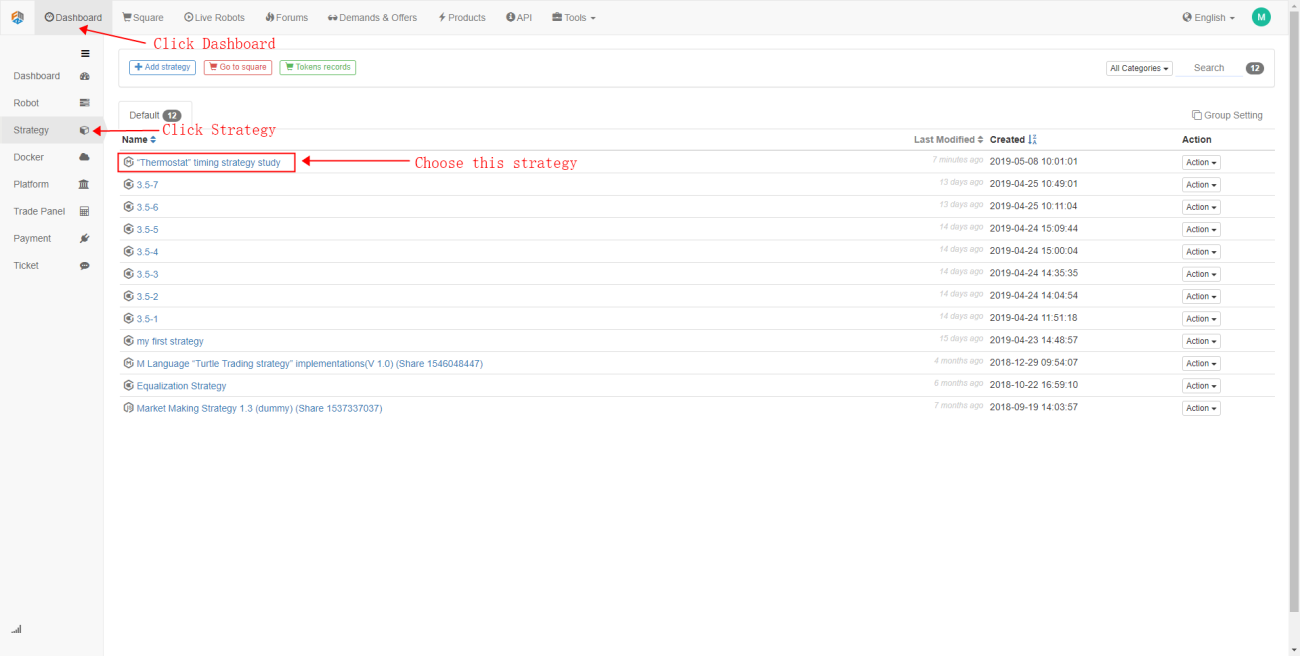
In the backtest configuration interface, you can customize it according to your actual needs. Such as: set backtest period, K line cycle, data type (simulation level data or real-market level data. In contrast, simulation level data backtesting speed is faster, real-market level data backtesting is more accurate). In addition, you can also set the commission fee for the backtest and the initial funds of the account.
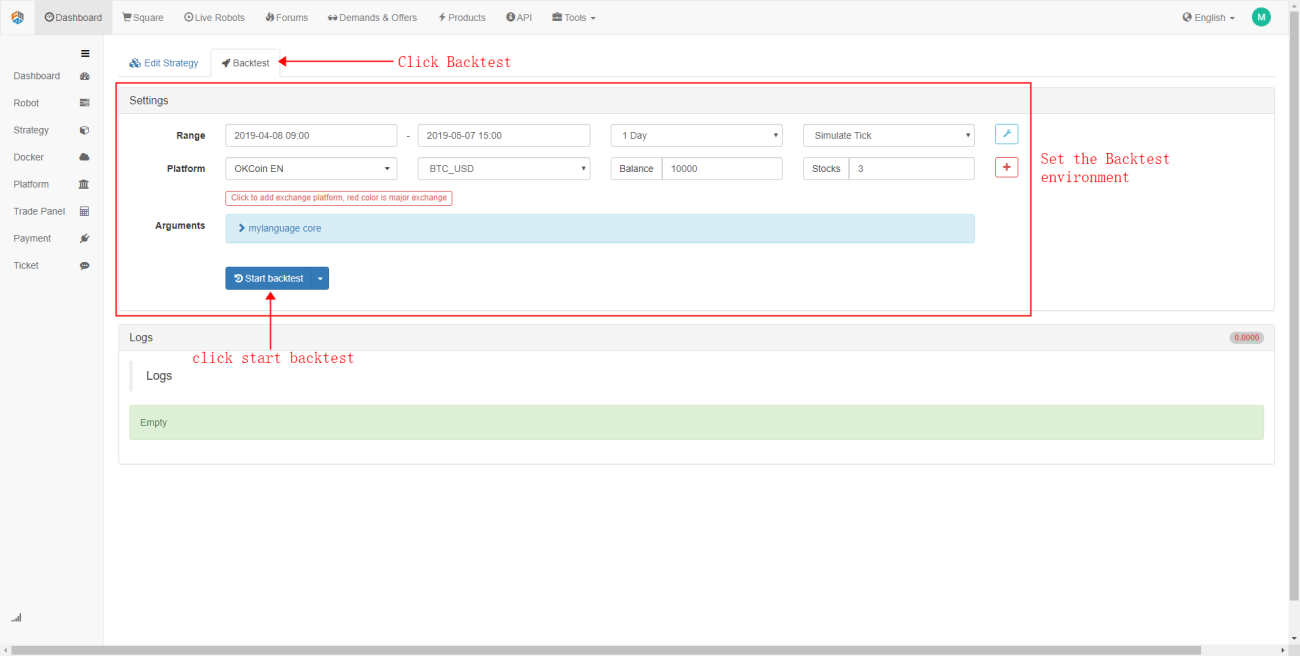
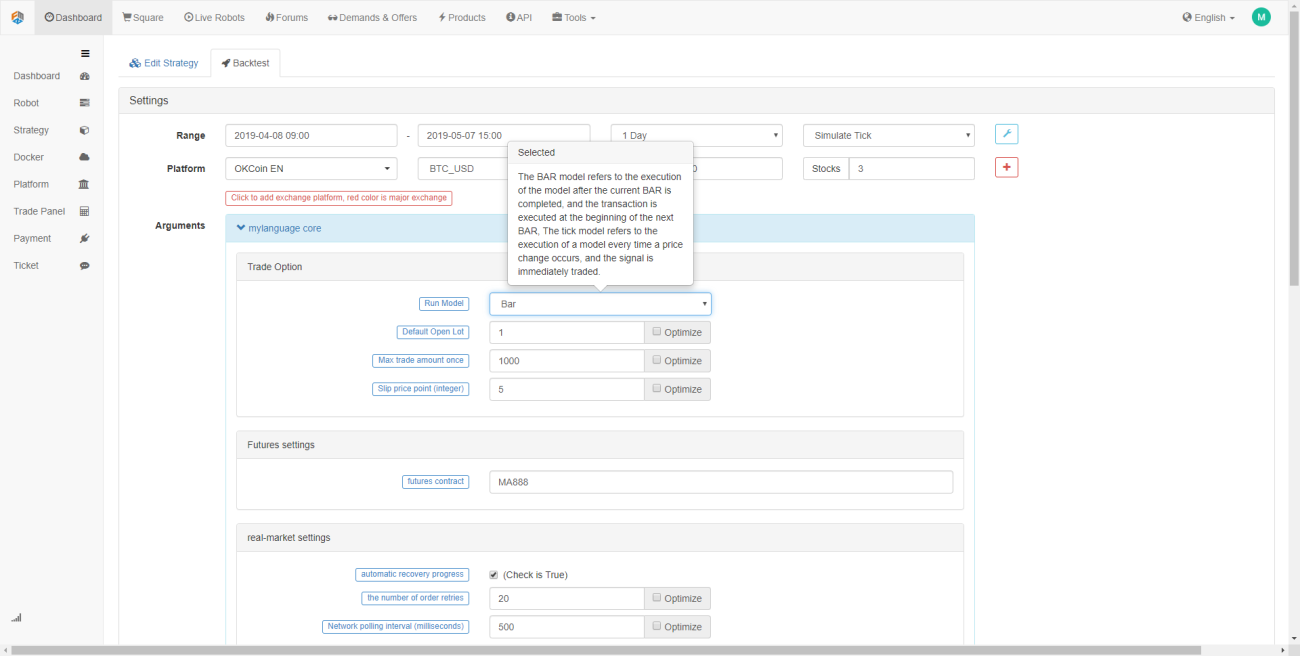
- Step 2
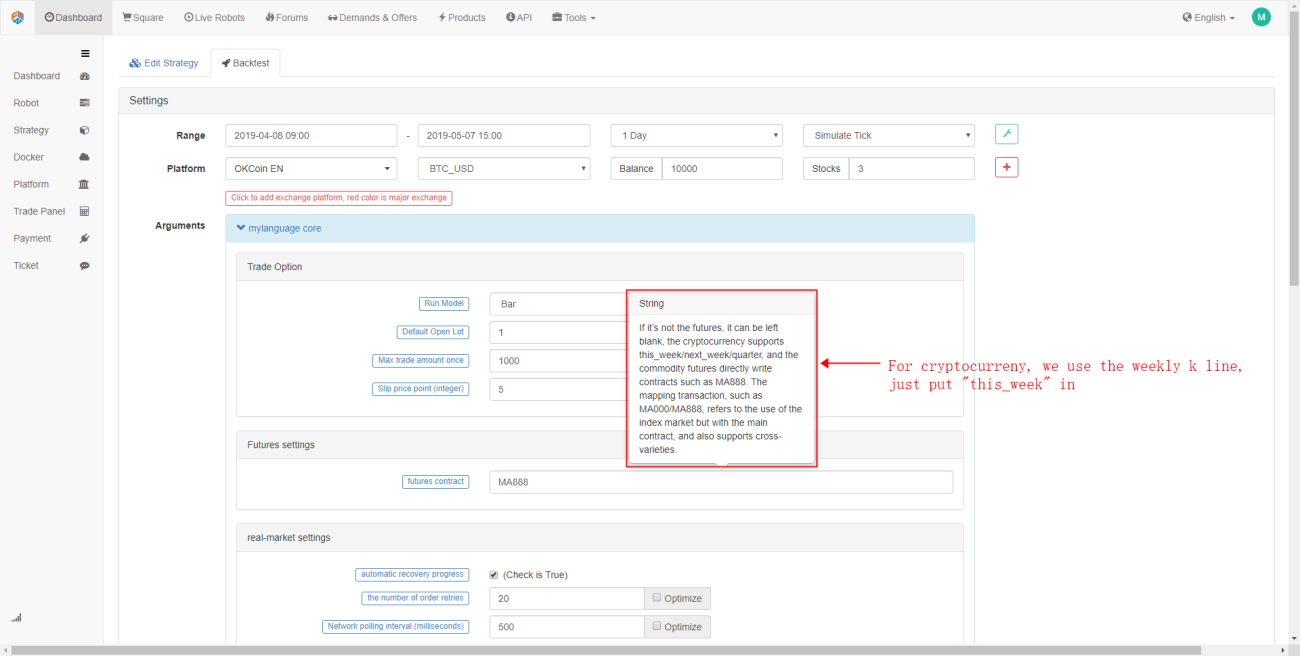
Click on the "mylanguage core" trading library (because this strategy is written by M language, if you use other programming language, this option may not appear) First of all, set the trading label. The FMZ Quant M language have two types of backtest execution methods, which are: the closing price model and the latest price model. The closing price model refers to the execution of the model after the current K line is completed, and the trading is executed at the beginning of the next K line; The latest price model refers to the execution of a model for each price change, and when the trading signal is established, it will trade immediately. As shown below:
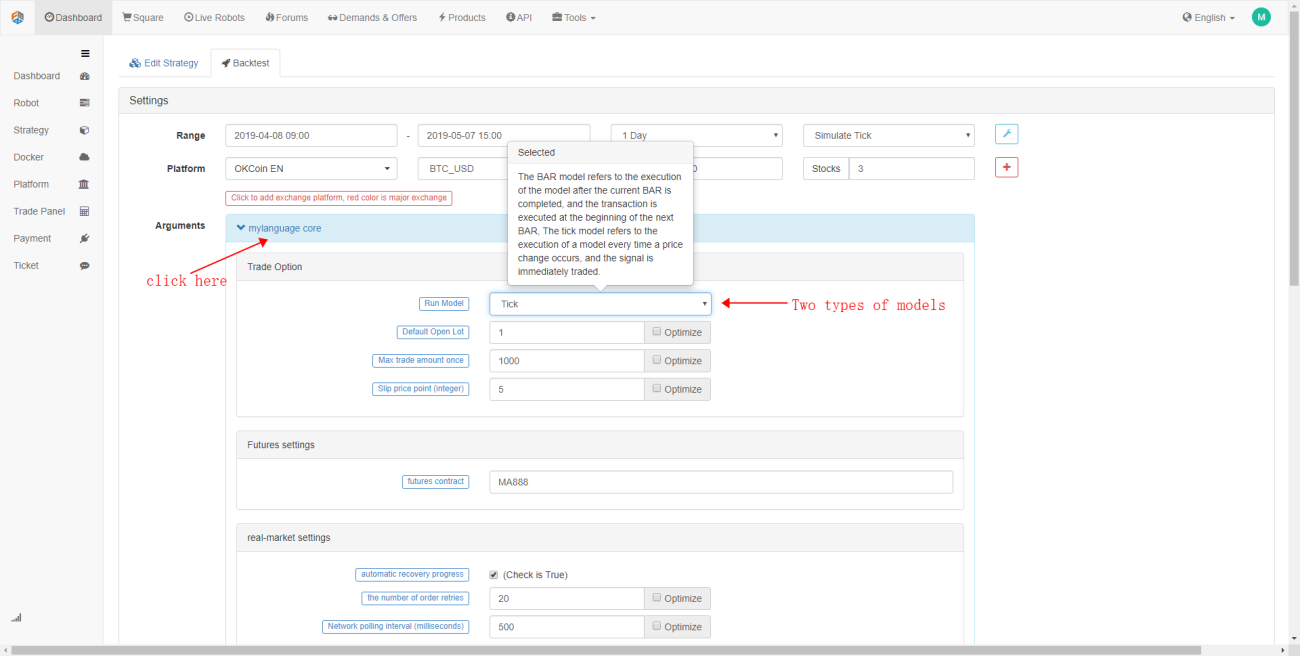
"The default open lot" size refers to the amount of opening and closing position when backtesting. "Max trade amount once" is the maximum opening position that is sent to the backtest engine by a single transaction.
There alway will be a deviation between the actual trading price and the planned trading price. This offset is generally moving in a direction that is not favorable to the trader, resulting in additional losses in the trading. Therefore, it is necessary to add slippage to simulate the real trading environment.
- Step 3
Fill in the "futures contract" with the type of contract you want to backtest, for cryptocurreny, we just need specify the period of k-line which we want to backtest, in this case, just use weekly k line, so, put "this_week" in.
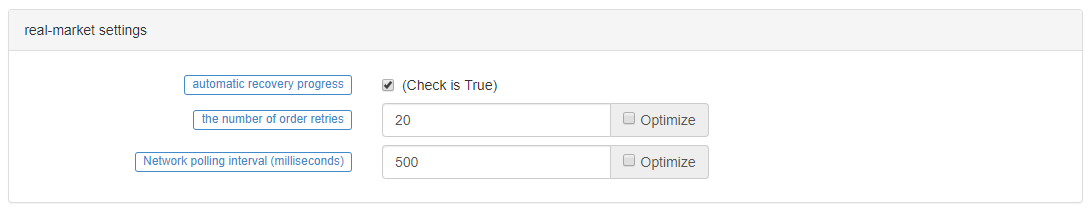
"real-market settings" option is mainly used for real-market trading, in the backtesting environment, we just maintain it default setting will be fine. If the "automatic recovery progress" is marked true, then when the robot stops in the real market, restarting the robot will automatically restore the previous signal position without recalculating the signal. "the number of order retries" set to 20 by default. When placing order fails, it will try to re-sending until 20 times. "Network polling interval (milliseconds)" is where the robot executes the strategy code every another time.
- Step 4
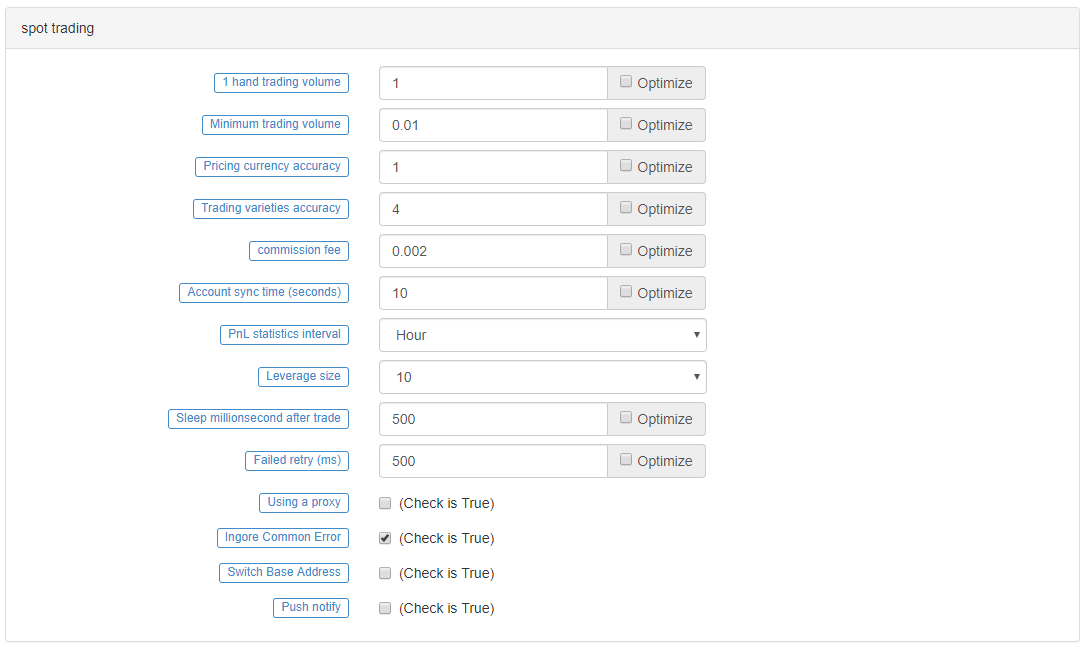
Spot trading option is primarily for cryptocurrency trading, when backtesting, keep it in the default settings will be fine. If you want, you can specify all the parameters in these settings. In addition, for some cryptocurrency exchanges, you can also set leverage sizes and other related settings.
Strategy Backtest
Before backtesting, determine your trading strategy. Here we take the "Thermostat" timing strategy as an example. This strategy will adopt a trend strategy in the trend market according to the market state, and adopt a Oscillating strategy in the volatile market. The source code is as shown below (can also be downloaded from the FMZ Quant Website's Strategy Square page):
// Calculate CMI indicator to distinguish between Oscillating and trend market
CMI:=ABS(C-REF(C,29))/(HHV(H,30)-LLV(L,30))*100;
// Define key prices
KOD:=(H+L+C)/3;
// In the Oscillating market, the closing price is greater than the key price is suitable for selling market, otherwise it is for buying market
BE:=IFELSE(C>KOD,1,0);
SE:=IFELSE(C<=KOD,1,0);
// Define 10-day ATR indicator
TR:=MAX(MAX((HIGH-LOW),ABS(REF(CLOSE,1)-HIGH)),ABS(REF(CLOSE,1)-LOW));
ATR10:=MA(TR,10);
// Define the highest and lowest price 3-day moving average
AVG3HI:=MA(H,3);
AVG3LO:=MA(L,3);
// Calculate the entry price of the Oscillating market
LEP:=IFELSE(C>KOD,O+ATR10*0.5,O+ATR10*0.75);
SEP:=IFELSE(C>KOD,O-ATR10*0.75,O-ATR10*0.5);
LEP1:=MAX(LEP,AVG3LO);
SEP1:=MIN(SEP,AVG3HI);
// Calculate the entry price of the trend market
UPBAND:=MA(C,50)+STD(C,50)*2;
DNBAND:=MA(C,50)-STD(C,50)*2;
// Calculate the quit price of the trend market
MA50:=MA(C,50);
// Oscillating strategy logic
CMI<20&&C>=LEP1,BK;
CMI<20&&C<=SEP1,SK;
CMI<20&&C>=AVG3HI,SP;
CMI<20&&C<=AVG3LO,BP;
// Trend strategy logic
CMI>=20&&C>=UPBAND,BK;
CMI>=20&&C<=DNBAND,SK;
CMI>=20&&C<=MA50,SP;
CMI>=20&&C>=MA50,BP;
AUTOFILTER;
In the simulation backtesting interface, after configuring the backtesting settings, click on the Start Backtest button, and the backtesting results will be displayed immediately after few seconds. In the backtest log, it will show how many seconds used for backtest, logs, and the total number of transaction. The account information prints the final results of the strategy backtest: average profit and loss, position profit and loss, margin, commission fees and estimated returns.
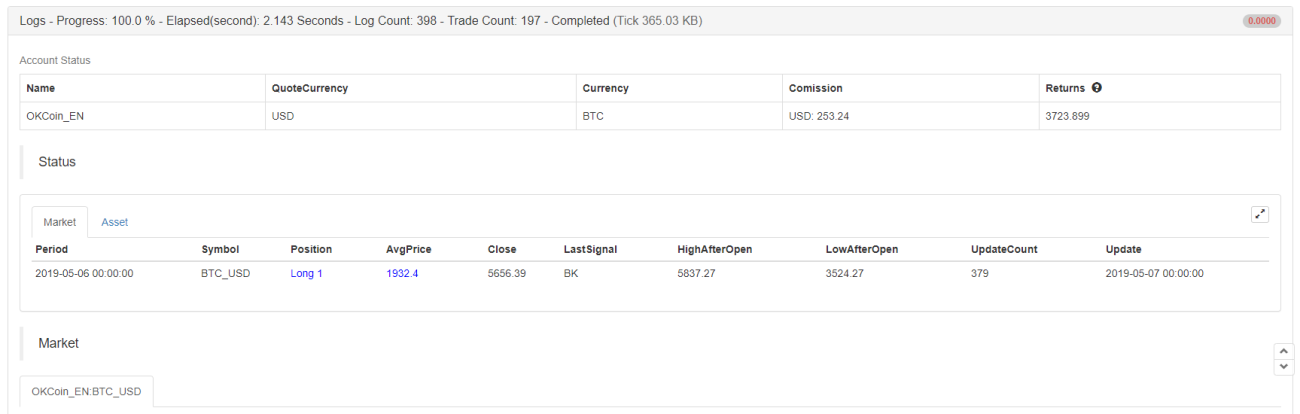
Status bar records the trading variety, positions, positions prices, the latest price, the previous trading signal types, the highest and lowest price of positions, the number of updates as well as capital and time information. In addition, in the floating profits and losses label, the detailed fund curve of the account is displayed, and the commonly used performance indicators are also included: the rate of return, the annualized rate of return, the Sharpe ratio, the annualized volatility, and the maximum retracement rate, which can basically satisfy the vast majority of users needs.
Among them, the most important performance indicator is: Sharpe ratio. It was while implementing comprehensive index consider the benefits and risks, and it is an important index to measure a fund products. In general, it is how much risk you bear, every time when you earn profit, so the Sharpe ratio value is higher, the better.
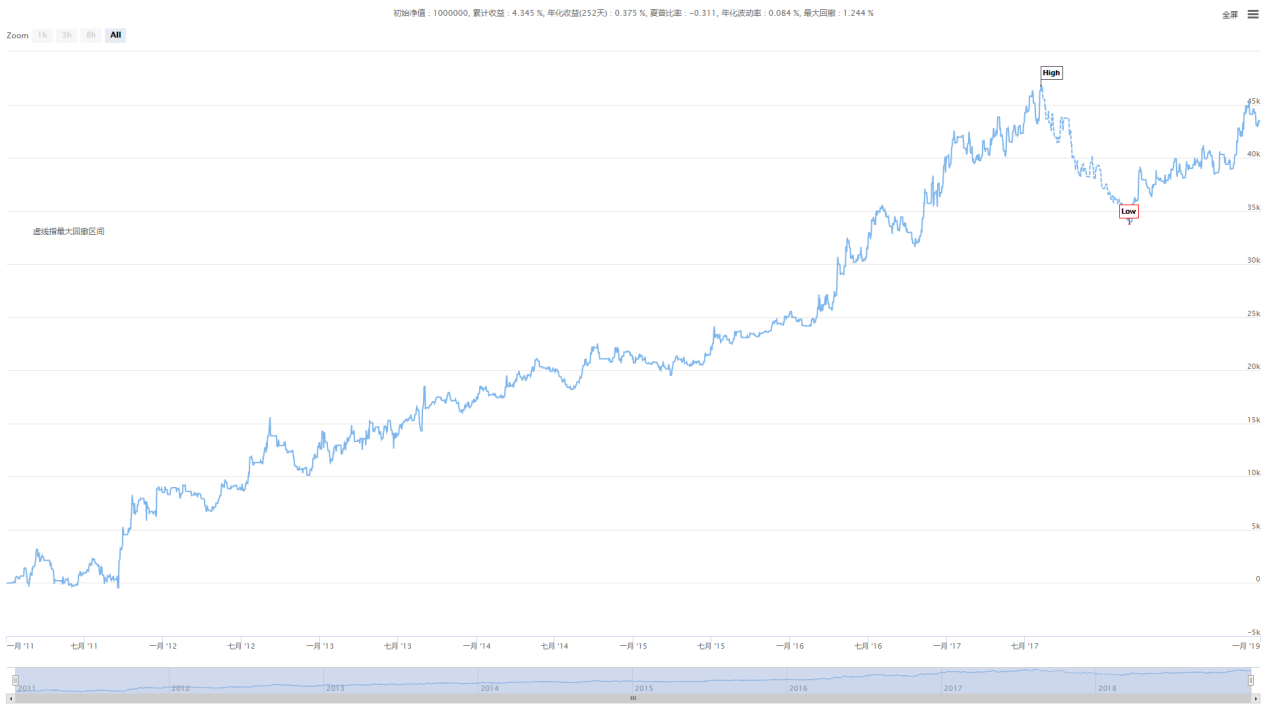
The annualized volatility, put simply, annualizing a figure assumes observations over a short time frame will continue over the course of a year. It is a measure of the risk of the fund, but it is definitely not the full risk. For example, Strategy A has a larger volatility, but it has been volatility upwards, the profit is good; Strategy B has a small volatility, but it has been steadily moving(barely not move at all). Can we say that Strategy B is better than Strategy A ? Strategy A as shown below :
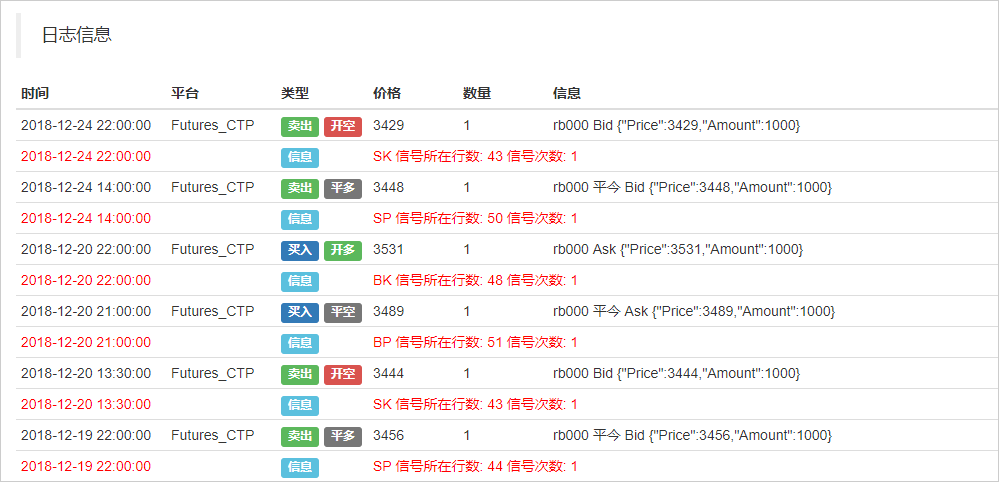
Finally, in the log information, a detailed record of each trading brokered situation when backtesting, including the specific time of the trading, the exchange information, the open and close position type, backtest engine match orders mechanism, as well as the number of transactions and print out informations.
After Backtesting
Many times, and in most cases, the results of backtesting will be far from what you expect. After all, a long-term, stable and profitable strategy is not so easy to get, which requires your ability to understand the market.
If your strategy backtest results are losing money, don't be discouraged. This is actually quite normal. check wether the strategy logic is been misinterpreted by the code, wether it is using some extreme parameters, is it using too much opening position conditions, etc. It is also necessary to re-examine the trading strategies and trading ideas from another angle.
If your strategy backtest results are very good, the funding curve is perfect, with a Sharpe ratio of higher than 1. Please don't be in a hurry, In this case, most of situations are using the future functions, stealing prices, over-fitting, or no slippage price added, etc. You can use the off-sample data and the simulation real-market trading to exclude these issues.
To sum up
The above is the entire process of the trading strategy backtesting, it can be said that it has been specific to every detail. It should be noted that historical data backtesting is an ideal environment where all risks are known. Therefore, it is best to go through a round of bull and bear market for the backtesting time of the strategy. The effective number of tradings should be no less than 100 times, so as to avoid some survivors' biases.
The market is always in the process of change and evolution. The historical backtesting strategy does not mean that the future will be the same. It is not only to let the strategy cope with the known possible risks in the backtesting environment, but also to deal with the unknown risks in the future. Therefore, it is very necessary to increase the risk resistance and universality of the strategy.
After-school exercises
-
Try to copy the strategy in this section and backtest it.
-
Try to improve and optimize the strategy in this section based on your trading experience.
- 1