
FMZ Quant Simulation Level Backtest Mechanism Description
-
1.Backtest Framework
The strategy program in the FMZ Quant backtest, the strategy program is a complete control flow, and the program is constantly polled according to a certain frequency. Every market quote and data returned by platform API simulate the actual runtime situations, according to the calling time. The backtest belongs to the onTick level, not the onBar level of other backtest systems. It supports better the backtest of strategies based on Ticker data (strategies with higher operating frequency).
-
2. Differences between Simulation Level and Real Market Level
-
Simulation Level
Simulation level backtest is based on the underlayer K-line data of the backtest system; it, according to a certain algorithm, within the framework composed of the given highest price, lowest price, open price and close price of the underlying K-line Bar, simulates the interpolation of ticker data into the time series of this Bar.
-
Real Market Level
The real market level backtest is the real ticker level data in the time series of Bar. For strategies based on ticker-level data, using the real market level backtest is closer to the reality.
In the real market level backtest, ticker is the actually recorded data, not simulated.
-
-
3.Simulation Level Backtest Mechanism -- Underlayer K-Line
There is no underlayer K-line option for real market level backtest (because the ticker data is real, the underlayer K-line will not be used for simulation).
In the simulation level backtest, the ticker data is simulated and generated based on the K-line data. This K-line data is the underlayer K-line. In the actual operation of the simulation level backtest, the period of the underlayer K-line must be smaller than the period of calling API to obtain the K-line, when the strategy is running. Otherwise, due to the large period of the underlayer K-line and the insufficient number of generated tickers, when the API is called to obtain the K-line of the specified period, the data will be distorted. When using a large-period K-line to backtest, you can appropriately set the underlayer K-line period bigger. -
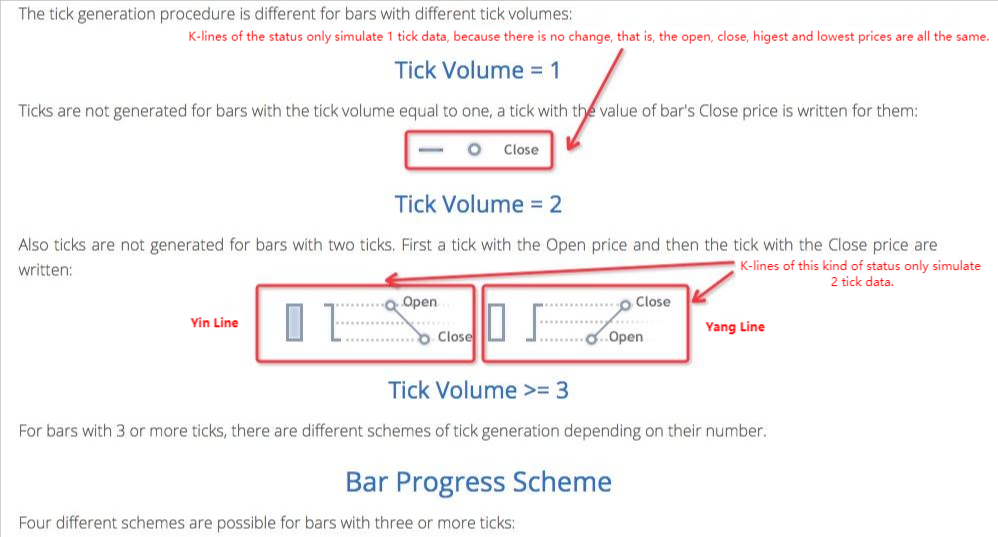
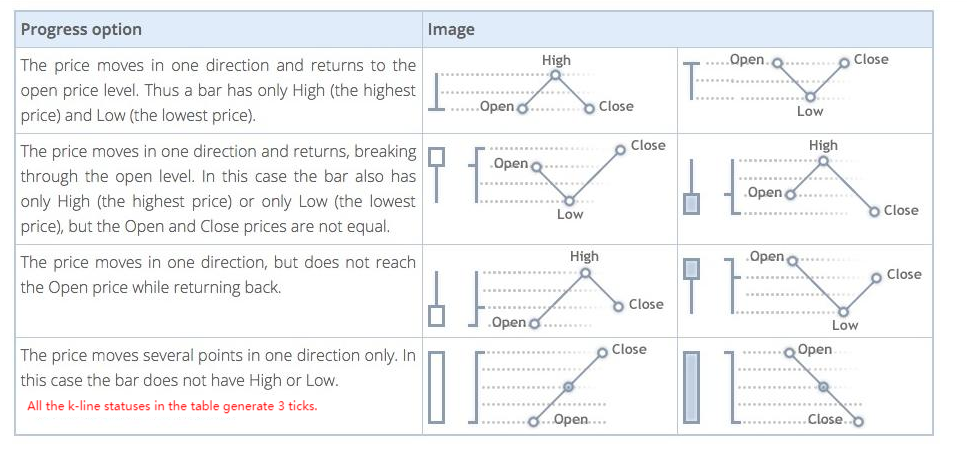
4.How does the underlayer K-line generate ticker data?
The mechanism of underlayer K-line generating simulated ticker is the same as MT4: related link
-
5. The Arithmetic Codes Generating Ticker Data
The specific algorithm to convert the underlayer K-line data to simulated tick data:
function recordsToTicks(period, num_digits, records) {
// http://www.metatrader5.com/en/terminal/help/tick_generation
if (records.length == 0) {
return []
}
var ticks = []
var steps = [0, 2, 4, 6, 10, 12, 16, 18, 23, 25, 27, 29]
var pown = Math.pow(10, num_digits)
function pushTick(t, price, vol) {
ticks.push([Math.floor(t), Math.floor(price * pown) / pown, vol])
}
for (var i = 0; i < records.length; i++) {
var T = records[i][0]
var O = records[i][1]
var H = records[i][2]
var L = records[i][3]
var C = records[i][4]
var V = records[i][5]
if (V > 1) {
V = V - 1
}
if ((O == H) && (L == C) && (H == L)) {
pushTick(T, O, V)
} else if (((O == H) && (L == C)) || ((O == L) && (H == C))) {
pushTick(T, O, V)
} else if ((O == C) && ((O == L) || (O == H))) {
pushTick(T, O, V / 2)
pushTick(T + (period / 2), (O == L ? H : L), V / 2)
} else if ((C == H) || (C == L)) {
pushTick(T, O, V / 2)
pushTick(T + (period * 0.382), (C == L ? H : L), V / 2)
} else if ((O == H) || (O == L)) {
pushTick(T, O, V / 2)
pushTick(T + (period * 0.618), (O == L ? H : L), V / 2)
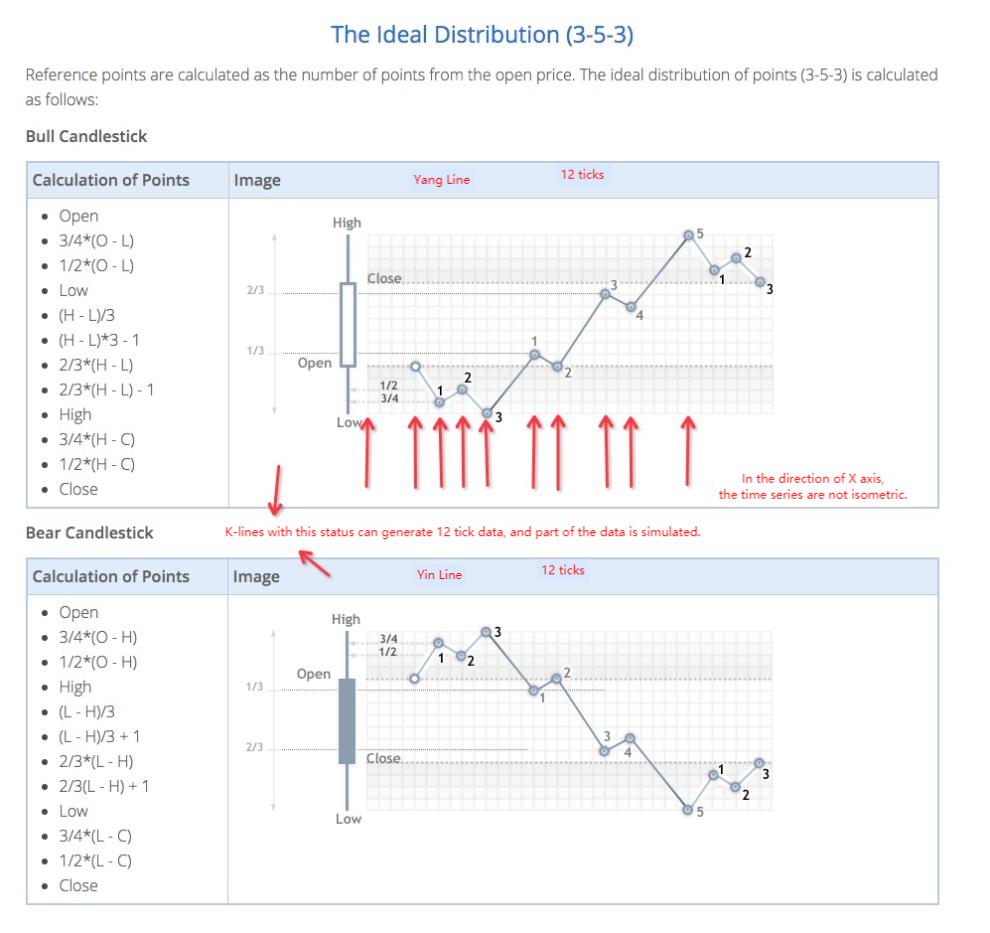
} else {
var dots = []
var amount = V / 11
pushTick(T, O, amount)
if (C > O) {
dots = [
O - (O - L) * 0.75,
O - (O - L) * 0.5,
L,
L + (H - L) / 3.0,
L + (H - L) * (4 / 15.0),
H - (H - L) / 3.0,
H - (H - L) * (6 / 15.0),
H,
H - (H - C) * 0.75,
H - (H - C) * 0.5,
]
} else {
dots = [
O + (H - O) * 0.75,
O + (H - O) * 0.5,
H,
H - (H - L) / 3.0,
H - (H - L) * (4 / 15.0),
H - (H - L) * (2 / 3.0),
H - (H - L) * (9 / 15.0),
L,
L + (C - L) * 0.75,
L + (C - L) * 0.5,
]
}
for (var j = 0; j < dots.length; j++) {
pushTick(T + period * (steps[j + 1] / 30.0), dots[j], amount)
}
}
pushTick(T + (period * 0.98), C, 1)
}
return ticks
}
Therefore, there will be price moving in the time series, when the simulation level backtest is run.
- 1