
Design a Multiple-Chart Plotting Library
This kind of library is often used to create charts and plots when writing and designing strategies. For a single custom chart, we can use the "plotting library" (users who are not familiar with the concept of the template library on FMZ can check the FMZ API documentation), which is very convenient for plotting operations. However, for scenarios that require multiple charts, this template library cannot meet the requirements. Then we learn the design ideas of this plotting library, and on this basis, design a multi-chart version of the plotting library.
Design the Export Functions of "Template Library"
Learning from the export function design of "plot Library", we can also design similar export functions for the multi-chart plotting library.
-
$.PlotMultRecords
Used to draw K-line charts, designed parameters: cfgName, seriesName, records, extension。
cfgName: as a single chart, the name of the configured object;
seriesName: the name of the data series that need to draw K-lines at the moment;
records: the K-line data passed in;
extension: the chart dimension configuration information, for example: pass{layout: 'single', col: 6, height: '600px'}, that is, request the chart with the configured object name of cfgName to solely display width: 6, height: 600px. -
$.PlotMultLine
Used to draw lines, designed parameters: cfgName, seriesName, dot, ts, extension
cfgName: as a single chart, the name of the configured object;
seriesName: the name of the data series that need to draw lines at the moment;
dot: the ordinate value of the dot on the lines to be drawn;
ts: timestamp, namely the value on the X time axis;
extension: the chart dimension configuration information. -
$.PlotMultHLine
Used to draw horizontal lines; designed parameters: cfgName, value, label, color, style
cfgName: the configured object in the chart;
value: the ordinate value of the horizontal line;
label: the display text on the horizontal line;
color: line color;
style: line style, for example:Solid ShortDash ShortDot ShortDashDot ShortDashDotDot Dot Dash LongDash DashDot LongDashDot LongDashDotDot. -
$.PlotMultTitle
Used to modify the title and sub-title of the chart; designed parameters: cfgName, title, chartTitle
cfgName: the configured object name;
title: sub-title;
chartTitle: the title of the chart. -
$.PlotMultFlag
Used to draw flag; designed parameters: cfgName, seriesName, ts, text, title, shape, color, onSeriesName
cfgName: the configured object in the chart;
seriesName: the name of the data series;
ts: timestamp;
text: the text in the flag;
title: the title of the flag;
shape: the shape of the flag;
color: the color of the flag;
onSeriesName: it is based on which data series to display on; the value is the id of the data series. -
$.GetArrCfg
Used to return the configured object array of the chart.
Design Test Functions
For easy understanding, I wrote remarks directly on the test functions, explaining what each function call does.
// test
function main() {
LogReset(10)
var i = 0
var prePrintTs = 0
while (true) {
var r = exchange.GetRecords() // Get K-line data
var t = exchange.GetTicker() // Get the real-time tick data
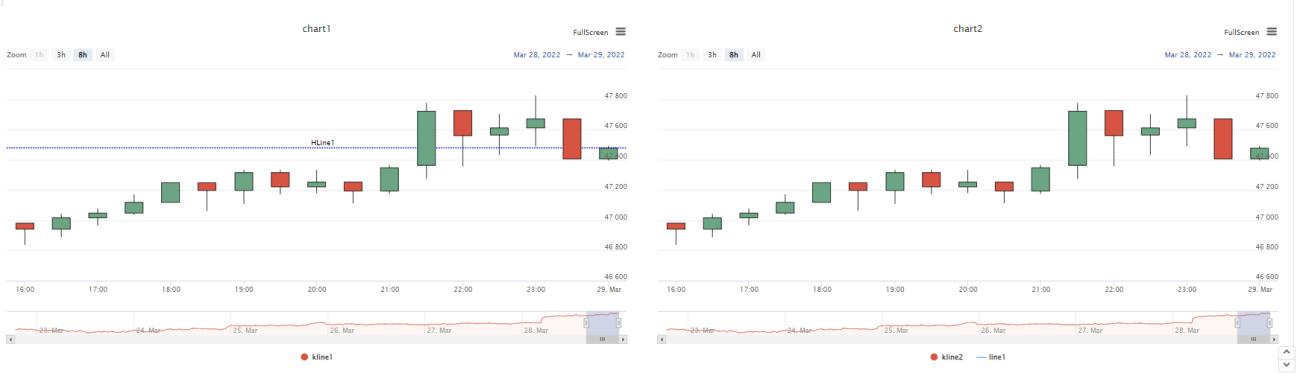
$.PlotMultRecords("chart1", "kline1", r, {layout: 'single', col: 6, height: '600px'}) // Create a K-line chart named chart1, and display it solely; the width is 6, and the height is 600px; the K-line data series name is kline1, and use r obtained above as the data source to draw the chart
$.PlotMultRecords("chart2", "kline2", r, {layout: 'single', col: 6, height: '600px'}) // Craete the second K-line chart, named chart2
$.PlotMultLine("chart2", "line1", t.Last, r[r.length - 1].Time) // Add a line to the K-line chart, namely chart2, the name of the data series is line1, and use the Last of the real-time tick data as the Y value of the dot on the line. The timestamp of the last BAR of the K-line data is used as the X value
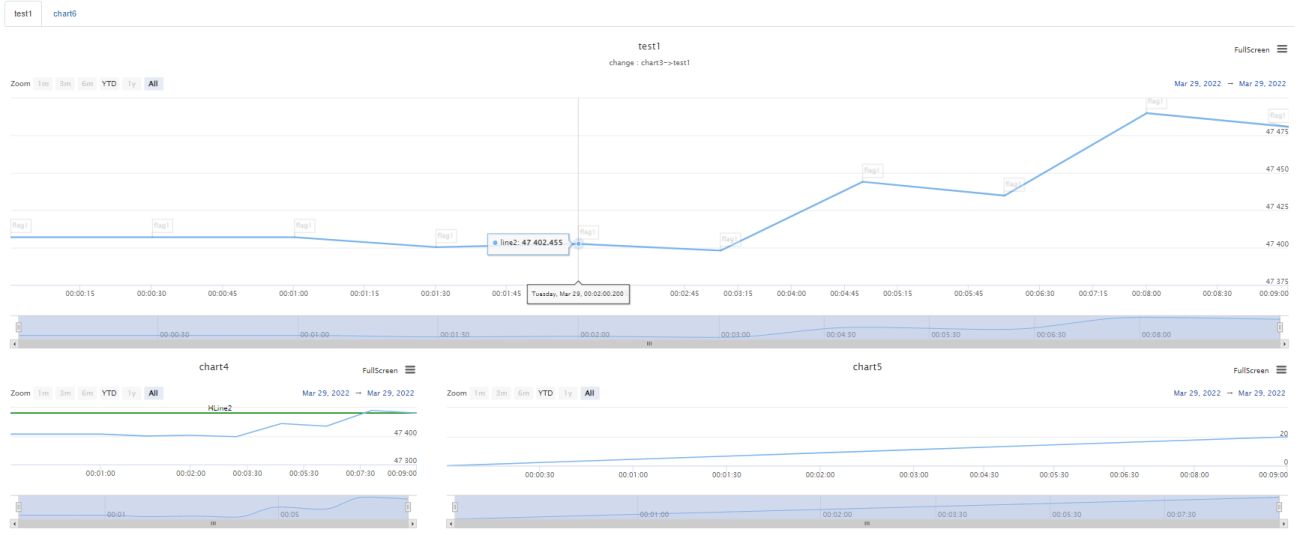
$.PlotMultLine("chart3", "line2", t.Last) // Create a chart named chart3 that only draws lines, with data series name line2; use the Last of real-time tick data to draw a dot at the current time (X value) (t.Last is Y value); note that the chart is not displayed solely
$.PlotMultLine("chart6", "line6", t.Time) // Create a chart chart6 that only draws lines; note that the chart is not displayed solely, it will be displayed with chart3 on pagination
$.PlotMultLine("chart4", "line3", t.Sell, new Date().getTime(), {layout: 'single', col: 4, height: '300px'}) // Create a chart named chart4 that only draws lines, solely displayed, width 4, height 300px
$.PlotMultLine("chart5", "line4", t.Volume, new Date().getTime(), {layout: 'single', col: 8, height: '300px'}) // Create a chart named chart5 that only draws lines, solely displayed, width 8, height 300px
$.PlotMultHLine("chart1", r[r.length - 1].Close, "HLine1", "blue", "ShortDot") // Add horizontal lines in chart1
$.PlotMultHLine("chart4", t.Sell, "HLine2", "green") // Add horizontal lines in chart4
$.PlotMultTitle("chart3", "change : chart3->test1", "test1") // Modify the title of chart3
var ts = new Date().getTime()
if (ts - prePrintTs > 1000 * 20) {
prePrintTs = ts
// when triggered, draw a flag on chart3
$.PlotMultFlag("chart3", "flag1", new Date().getTime(), "flag test", "flag1")
}
if (i == 10) {
Log("i == 10")
// when triggered, draw a flag on chart4, and chart1
$.PlotMultFlag("chart4", "flag2", new Date().getTime(), "flag test", "flag2")
$.PlotMultFlag("chart1", "flag3", new Date().getTime(), "flag test", "flag3", "squarepin", "green", "kline1")
} else if (i == 20) {
Log("i == 20")
// when triggered, add a line on chart1, but only draw a dot of the line; X coordinate is timestamp, and Y coordinate is the value of t.Last
$.PlotMultLine("chart1", "line5", t.Last, r[r.length - 1].Time)
} else if (i == 30) {
Log("i == 30")
// when triggered, draw a flag on chart2
$.PlotMultFlag("chart2", "flag4", new Date().getTime(), "flag test", "flag4", "circlepin", "black", "kline2")
}
Sleep(1000 * 5)
i++
}
}
Operation Test
You can see that with only one line of function call, you can easily draw a chart, and you can display multiple kinds of charts at the same time.
Complete Strategy Source Code
Parameter settings:
Implementation of the strategy source code:
            var registerInfo = {}
var chart = null
var arrCfg = []

function updateSeriesIdx() {
    var index = 0
    var map = {}
    _.each(arrCfg, function(cfg) {
        _.each(cfg.series, function(series) {
            var key = cfg.name + "|" + series.name
            map[key] = index
            index++
        })
    })

    for (var cfgName in registerInfo) {
        for (var i in registerInfo[cfgName].seriesIdxs) {
            var seriesName = registerInfo[cfgName].seriesIdxs[i].seriesName
            var key = cfgName + "|" + seriesName
            if (map[key]) {
                registerInfo[cfgName].seriesIdxs[i].index = map[key]
            }

            // Reset preBarTime of K-line data
            if (registerInfo[cfgName].seriesIdxs[i].type == "candlestick") {
                registerInfo[cfgName].seriesIdxs[i].preBarTime = 0
            } else if (registerInfo[cfgName].seriesIdxs[i].type == "line") {
                registerInfo[cfgName].seriesIdxs[i].preDotTime = 0
            } else if (registerInfo[cfgName].seriesIdxs[i].type == "flag") {
                registerInfo[cfgName].seriesIdxs[i].preFlagTime = 0
            }
        }
    }

    if (!chart) {
        chart = Chart(arrCfg)
    }
    chart.update(arrCfg)
    chart.reset()

    _G("registerInfo", registerInfo)
    _G("arrCfg", arrCfg)

    for (var cfgName in registerInfo) {
        for (var i in registerInfo[cfgName].seriesIdxs) {
            var buffer = registerInfo[cfgName].seriesIdxs[i].buffer
            var index = registerInfo[cfgName].seriesIdxs[i].index
            if (buffer && buffer.length != 0 && registerInfo[cfgName].seriesIdxs[i].type == "line" && registerInfo[cfgName].seriesIdxs[i].preDotTime == 0) {
                _.each(buffer, function(obj) {
                    chart.add(index, [obj.ts, obj.dot])
                    registerInfo[cfgName].seriesIdxs[i].preDotTime = obj.ts
                })
            } else if (buffer && buffer.length != 0 && registerInfo[cfgName].seriesIdxs[i].type == "flag" && registerInfo[cfgName].seriesIdxs[i].preFlagTime == 0) {
                _.each(buffer, function(obj) {
                    chart.add(index, obj.data)
                    registerInfo[cfgName].seriesIdxs[i].preFlagTime = obj.ts
                })
            }
        }
    }
}

function checkBufferLen(buffer, maxLen) {
    while (buffer.length > maxLen) {
        buffer.shift()
    }
}

$.PlotMultRecords = function(cfgName, seriesName, records, extension) {
    if (typeof(cfgName) == "undefined") {
        throw "need cfgName!"
    }

    var index = -1
    var eleIndex = -1

    do {
        var cfgInfo = registerInfo[cfgName]
        if (typeof(cfgInfo) == "undefined") {
            var cfg = {
                name : cfgName,
                __isStock: true,
                title : {
                    text: cfgName
                },
                tooltip: {
                    xDateFormat: '%Y-%m-%d %H:%M:%S, %A'
                },
                legend: {
                    enabled: true,
                },
                plotOptions: {
                    candlestick: {
                        color: '#d75442',
                        upColor: '#6ba583'
                    }
                },
                rangeSelector: {
                    buttons: [{
                        type: 'hour',
                        count: 1,
                        text: '1h'
                    }, {
                        type: 'hour',
                        count: 3,
                        text: '3h'
                    }, {
                        type: 'hour',
                        count: 8,
                        text: '8h'
                    }, {
                        type: 'all',
                        text: 'All'
                    }],
                    selected: 2,
                    inputEnabled: true
                },
                series: [{
                    type: 'candlestick',
                    name: seriesName,
                    id: seriesName,
                    data: []
                }],
            }

            if (typeof(extension) != "undefined") {
                cfg.extension = extension
            }

            registerInfo[cfgName] = {
                "cfgIdx" : arrCfg.length,
                "seriesIdxs" : [{seriesName: seriesName, index: arrCfg.length, type: "candlestick", preBarTime: 0}],
            }
            arrCfg.push(cfg)
            updateSeriesIdx()
        }

        if (!chart) {
            chart = Chart(arrCfg)
        } else {
            chart.update(arrCfg)
        }

        _.each(registerInfo[cfgName].seriesIdxs, function(ele, i) {
            if (ele.seriesName == seriesName && ele.type == "candlestick") {
                index = ele.index
                eleIndex = i
            }
        })
        if (index == -1) {
            arrCfg[registerInfo[cfgName].cfgIdx].series.push({
                type: 'candlestick',
                name: seriesName,
                id: seriesName,
                data: []
            })
            registerInfo[cfgName].seriesIdxs.push({seriesName: seriesName, index: arrCfg.length, type: "candlestick", preBarTime: 0})
            updateSeriesIdx()
        }
    } while (index == -1)

    for (var i = 0 ; i < records.length ; i++) {
        if (records[i].Time == registerInfo[cfgName].seriesIdxs[eleIndex].preBarTime) {
            chart.add(index, [records[i].Time, records[i].Open, records[i].High, records[i].Low, records[i].Close], -1)
        } else if (records[i].Time > registerInfo[cfgName].seriesIdxs[eleIndex].preBarTime) {
            registerInfo[cfgName].seriesIdxs[eleIndex].preBarTime = records[i].Time
            chart.add(index, [records[i].Time, records[i].Open, records[i].High, records[i].Low, records[i].Close])
        }
    }

    return chart
}

$.PlotMultLine = function(cfgName, seriesName, dot, ts, extension) {
    if (typeof(cfgName) == "undefined") {
        throw "need cfgName!"
    }

    var index = -1
    var eleIndex = -1

    do {
        var cfgInfo = registerInfo[cfgName]
        if (typeof(cfgInfo) == "undefined") {
            var cfg = {
                name : cfgName,
                __isStock: true,
                title : {
                    text: cfgName
                },
                xAxis: {
                    type: 'datetime'
                },
                series: [{
                    type: 'line',
                    name: seriesName,
                    id: seriesName,
                    data: [],
                }]
            }

            if (typeof(extension) != "undefined") {
                cfg.extension = extension
            }

            registerInfo[cfgName] = {
                "cfgIdx" : arrCfg.length,
                "seriesIdxs" : [{seriesName: seriesName, index: arrCfg.length, type: "line", buffer: [], preDotTime: 0}],
            }
            arrCfg.push(cfg)
            updateSeriesIdx()
        }

        if (!chart) {
            chart = Chart(arrCfg)
        } else {
            chart.update(arrCfg)
        }

        _.each(registerInfo[cfgName].seriesIdxs, function(ele, i) {
            if (ele.seriesName == seriesName && ele.type == "line") {
                index = ele.index
                eleIndex = i
            }
        })
        if (index == -1) {
            arrCfg[registerInfo[cfgName].cfgIdx].series.push({
                type: 'line',
                name: seriesName,
                id: seriesName,
                data: [],
            })
            registerInfo[cfgName].seriesIdxs.push({seriesName: seriesName, index: arrCfg.length, type: "line", buffer: [], preDotTime: 0})
            updateSeriesIdx()
        }
    } while (index == -1)

    if (typeof(ts) == "undefined") {
        ts = new Date().getTime()
    }

    var buffer = registerInfo[cfgName].seriesIdxs[eleIndex].buffer
    if (registerInfo[cfgName].seriesIdxs[eleIndex].preDotTime != ts) {
        registerInfo[cfgName].seriesIdxs[eleIndex].preDotTime = ts
        chart.add(index, [ts, dot])
        buffer.push({ts: ts, dot: dot})
        checkBufferLen(buffer, maxBufferLen)
    } else {
        chart.add(index, [ts, dot], -1)
        buffer[buffer.length - 1].dot = dot
    }

    return chart
}

$.PlotMultHLine = function(cfgName, value, label, color, style) {
    if (typeof(cfgName) == "undefined" || typeof(registerInfo[cfgName]) == "undefined") {
        throw "need cfgName!"
    }

    var cfg = arrCfg[registerInfo[cfgName].cfgIdx]
    if (typeof(cfg.yAxis) == "undefined") {
        cfg.yAxis = {
            plotLines: []
        }
    } else if (typeof(cfg.yAxis.plotLines) == "undefined") {
        cfg.yAxis.plotLines = []
    }

    var obj = {
        value: value,
        color: color || 'red',
        width: 2,
        dashStyle: style || 'Solid',
        label: {
            text: label || '',
            align: 'center'
        },
    }
    var found = false
    for (var i = 0; i < cfg.yAxis.plotLines.length; i++) {
        if (cfg.yAxis.plotLines[i].label.text == label) {
            cfg.yAxis.plotLines[i] = obj
            found = true
        }
    }

    if (!found) {
        cfg.yAxis.plotLines.push(obj)
    }
    if (!chart) {
        chart = Chart(arrCfg)
    } else {
        chart.update(arrCfg)
    }

    return chart
}

$.PlotMultTitle = function(cfgName, title, chartTitle) {
    if (typeof(cfgName) == "undefined" || typeof(registerInfo[cfgName]) == "undefined") {
        throw "need cfgName!"
    }

    var cfg = arrCfg[registerInfo[cfgName].cfgIdx]

    cfg.subtitle = {
        text: title
    }

    if (typeof(chartTitle) !== 'undefined') {
        cfg.title = {
            text: chartTitle
        }
    }

    if (chart) {
        chart.update(arrCfg)
    }

    return chart
}

$.PlotMultFlag = function(cfgName, seriesName, ts, text, title, shape, color, onSeriesName) {
    if (typeof(cfgName) == "undefined" || typeof(registerInfo[cfgName]) == "undefined") {
        throw "need cfgName!"
    }

    var index = -1
    var eleIndex = -1

    do {
        if (!chart) {
            chart = Chart(arrCfg)
        } else {
            chart.update(arrCfg)
        }

        _.each(registerInfo[cfgName].seriesIdxs, function(ele, i) {
            if (ele.seriesName == seriesName && ele.type == "flag") {
                index = ele.index
                eleIndex = i
            }
        })
        if (index == -1) {
            arrCfg[registerInfo[cfgName].cfgIdx].series.push({
                type: 'flags',
                name: seriesName,
                onSeries: onSeriesName || arrCfg[registerInfo[cfgName].cfgIdx].series[0].id,
                data: []
            })
            registerInfo[cfgName].seriesIdxs.push({seriesName: seriesName, index: arrCfg.length, type: "flag", buffer: [], preFlagTime: 0})
            updateSeriesIdx()
        }
    } while(index == -1)

    if (typeof(ts) == "undefined") {
        ts = new Date().getTime()
    }

    var buffer = registerInfo[cfgName].seriesIdxs[eleIndex].buffer
    var obj = {x: ts, color: color, shape: shape, title: title, text: text}
    if (registerInfo[cfgName].seriesIdxs[eleIndex].preFlagTime != ts) {
        registerInfo[cfgName].seriesIdxs[eleIndex].preFlagTime = ts
        chart.add(index, obj)
        buffer.push({ts: ts, data: obj})
        checkBufferLen(buffer, maxBufferLen)
    } else {
        chart.add(index, obj, -1)
        buffer[buffer.length - 1].data = obj
    }

    return chart
}

$.GetArrCfg = function() {
    return arrCfg
}

function init() {
    if (isChartReset) {
        Log("Reset the chart", "#FF0000")
        chart = Chart(arrCfg)
        chart.reset()

        Log("Empty the persistent data, key:", "registerInfo、arrCfg #FF0000")
        _G("registerInfo", null)
        _G("arrCfg", null)
    } else {
        var multChartRegisterInfo = _G("registerInfo")
        var multChartArrCfg = _G("arrCfg")
        if (multChartRegisterInfo && multChartArrCfg) {
            registerInfo = multChartRegisterInfo
            arrCfg = multChartArrCfg
            Log("Recover registerInfo、arrCfg #FF0000")
        } else {
            Log("No data can be recovered #FF0000")
        }
    }
}

function onexit() {
    _G("registerInfo", registerInfo)
    _G("arrCfg", arrCfg)
    Log("Save data, key : registerInfo, arrCfg #FF0000")
}


// test
function main() {
    LogReset(10)
    var i = 0
    var prePrintTs = 0

    while (true) {
        var r = exchange.GetRecords()
        var t = exchange.GetTicker()

        $.PlotMultRecords("chart1", "kline1", r, {layout: 'single', col: 6, height: '600px'})
        $.PlotMultRecords("chart2", "kline2", r, {layout: 'single', col: 6, height: '600px'})
        $.PlotMultLine("chart2", "line1", t.Last, r[r.length - 1].Time)
        $.PlotMultLine("chart3", "line2", t.Last)
        $.PlotMultLine("chart6", "line6", t.Time)
        $.PlotMultLine("chart4", "line3", t.Sell, new Date().getTime(), {layout: 'single', col: 4, height: '300px'})
        $.PlotMultLine("chart5", "line4", t.Volume, new Date().getTime(), {layout: 'single', col: 8, height: '300px'})

        $.PlotMultHLine("chart1", r[r.length - 1].Close, "HLine1", "blue", "ShortDot")
        $.PlotMultHLine("chart4", t.Sell, "HLine2", "green")
        $.PlotMultTitle("chart3", "change : chart3->test1", "test1")

        var ts = new Date().getTime()
        if (ts - prePrintTs > 1000 * 20) {
            prePrintTs = ts
            $.PlotMultFlag("chart3", "flag1", new Date().getTime(), "flag test", "flag1")
        }

        if (i == 10) {
            Log("i == 10")
            $.PlotMultFlag("chart4", "flag2", new Date().getTime(), "flag test", "flag2")
            $.PlotMultFlag("chart1", "flag3", new Date().getTime(), "flag test", "flag3", "squarepin", "green", "kline1")
        } else if (i == 20) {
            Log("i == 20")
            $.PlotMultLine("chart1", "line5", t.Last, r[r.length - 1].Time)
        } else if (i == 30) {
            Log("i == 30")
            $.PlotMultFlag("chart2", "flag4", new Date().getTime(), "flag test", "flag4", "circlepin", "black", "kline2")
        }

        Sleep(1000 * 5)
        i++
    }
}
Strategy Address: https://www.fmz.com/strategy/353264
Here I only use this to start the discussion and thinking of the topic. If you are interested, you can increase the supported chart types (such as market depth chart, bar graph and pie chart, etc.) and keep upgrading.
- 1