
Novice, Check it Out —— Take You to Cryptocurrency Quantitative Trading (4)
In the first few articles, I learned so many basic concepts of cryptocurrency circle as well as programmatic and quantitative trading. Finally, we can cut to the main topic and talk about the strategy itself. In the article, we will learn to implement a simple strategy.
For [Grid Strategy], students who do trading should have heard of it, but it doesn't matter if you haven't. Now all major platforms have launched their own programmatic and quantitative trading functions, and the most commonly and the most easily used strategy is Grid strategy. However, the grid strategy functions and details provided by each platform are different. Since we plan to enter the quantification in the cryptocurrency circle, why don't we just implement a grid strategy ourselves?
Then, some students might say:
"I can't write codes!"
"Codes make me anxious!"
That's true. It is indeed quite difficult for students who do not major in computer software and have not been engaged in programming work to develop a complete trading strategy by themselves. Because you have to do a series of pre-work from docking the platform interface (maybe your trading logic program is only 100 lines, but the other coding work to be done is quite a lot, and it is more difficult than writing trading logic.)
At this time, if you have a very handy tool, it will be quite simple, at least the difficulty is reduced by 70%. You can imagine, if you only write the trading logic, other work, including docking platform interface, signature verification, configuration files, operating environment construction, UI interface writing, interactive writing and other functions, is all ready-made, how convenient and fast it is.
Don't believe it?
Let's try it!
Realize A Simple Spot Grid Strategy
The tool we use is: FMZ Quant Trading Platform (FMZ.COM). The core of grid strategy design is actually the logic of grid buying and selling, so this is something that must be clarified before designing a strategy. Our goal is to make the strategy design simple and easy to understand, so the fewer parameters and the simpler the logic, the better it is.
The basic procedures of designing a strategy are as follows:
-
1.Strategy requirement summary
Simply put, they are what your strategy will do, how to do, and what functions it has. That information can be written in a document (something like notebook) before you actually write the strategy code. It is very simple to develop strategies on FMZ. The platform provides you with solutions to these requirements, and you don't need to write these requirements in some notebook (which is not very convenient to manage). You can write the strategy requirements directly in the strategy note.
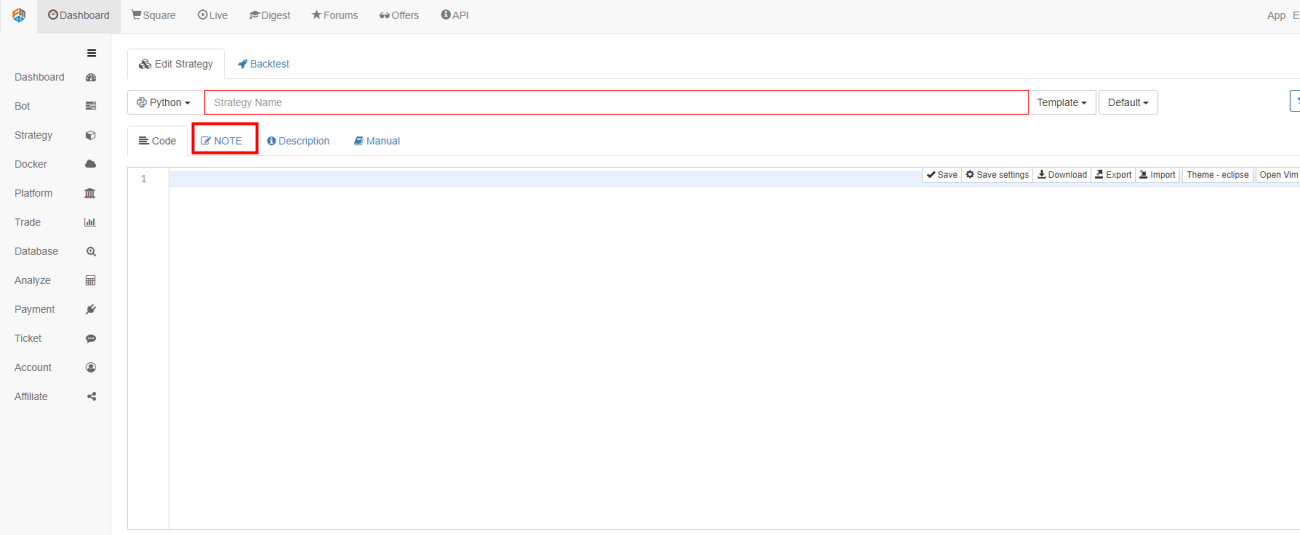
Remember to save the strategy when you finish writing, and then we continue to write the strategy requirements (those requiremnts are not unchanged; you can record and develop at the same time).
- The strategy is designed as a spot taring strategy; the trading pair is
XXX_USDT, such asBTC_USDT. - The grid is designed to be equal difference interval; ti be simple, the interval between the two adjacent dots in the grid is a fixed spread.
- The grid is designed to be an infinite grid that can extend without limits.
- The way of ordering uses market order.
- The strategy is designed as a spot taring strategy; the trading pair is
-
2.Construct grid data structure:
For the unclear ideas, we can plot to analyze at the beginning.
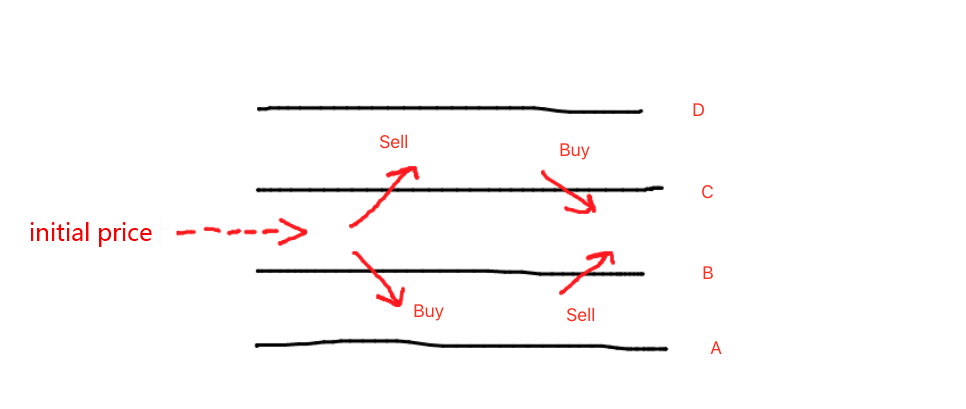
Grids can be constructed in both up and down directions from the base point, the initial price at the beginning. The so-called grid is composed of layers of bid lines and ask lines. Looking at the graph, we can see that each line has two possibilities:
- upcross the price;
- downcross the price.
Upcrossing the price means the price is getting high; we need to sell, and then buy in when the price falls after the rise, to make a profit.
Downcrossing the price means the price is getting low; we need to buy, and then sell when the price rises after the fall, to make a profit.
Therefore, each grid line has two ways of trading: buy (bid) and sell (ask). moreover, each grid line has a fixed attribute, which is the price marked with the line, such as A, B, C, D shown in the picture.
When designing a strategy, we should first figure out what we really want, and then it will be convenient to do it.
Coding a function of constructing grid data structure:
function createNet(begin, diff) { // begin and diff are parameters; begin is the initial price, and diff is the grid interval (the interval of the equal difference grid is a price) var oneSideNums = 10 // The grid generates 10 lines on both upward and downward sides. The above image only shows the situation of generating 2 lines on both sides (A and B on on side; C and D on the other side), and you can imagine the situation of generating 10 lines. var up = [] // used to store the data structure of the upward "grid lines" var down = [] // used to store the data structure of the downward "grid lines" for (var i = 0 ; i < oneSideNums ; i++) { // determine the number of times according to the number of oneSideNums; construct the "grid line" data structure by loop var upObj = { // construct the data structure of a upward "grid line" buy : false, // buy mark; the initial mark is false, which means no buying sell : false, // sell mark ... price : begin + diff / 2 + i * diff, // the price position represented by the "grid line", which can be observed and processed according to the loop; the price position is getting higher successively } up.push(upObj) // put the constructed "grid line" data structure into the up array var j = (oneSideNums - 1) - i // when in the loop, j changes from 9 to 0 var downObj = { buy : false, sell : false, price : begin - diff / 2 - j * diff, } if (downObj.price <= 0) { // the price cannot be less than or equal to 0 continue } down.push(downObj) // put the constructed "grid line" data structure into the down array } return down.concat(up) // add "up" after "down", forming a grid array structure with grid line prices from low to high }You can individually perform the function to see the result. The "Debug tool" on FMZ or "Backtest system" are all very convenient to debug this kind of short codes.
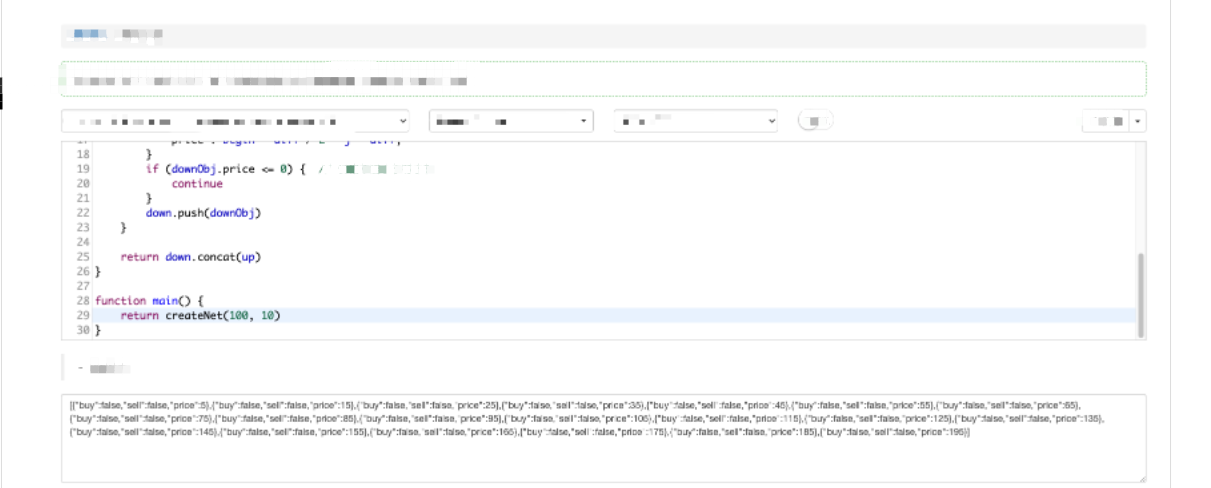
The constructed data can be observed.
[ {"buy":false,"sell":false,"price":5}, {"buy":false,"sell":false,"price":15}, {"buy":false,"sell":false,"price":25}, {"buy":false,"sell":false,"price":35}, {"buy":false,"sell":false,"price":45}, {"buy":false,"sell":false,"price":55}, {"buy":false,"sell":false,"price":65}, {"buy":false,"sell":false,"price":75}, {"buy":false,"sell":false,"price":85}, {"buy":false,"sell":false,"price":95}, {"buy":false,"sell":false,"price":105}, // 100 is the initial price, the first line goes up is from 105, and the interval is 10 {"buy":false,"sell":false,"price":115}, // ... {"buy":false,"sell":false,"price":125}, {"buy":false,"sell":false,"price":135}, {"buy":false,"sell":false,"price":145}, {"buy":false,"sell":false,"price":155}, {"buy":false,"sell":false,"price":165}, {"buy":false,"sell":false,"price":175}, {"buy":false,"sell":false,"price":185}, {"buy":false,"sell":false,"price":195} ] -
- Trading logic analysis
After analyzing the data structure of the grid, we need to consider the specific trading logic of the grid strategy. In fact, the logic of buying and selling is also very simple. We have already drawn it in the above picture. Buying means downcrossing a certain line, and selling means upcrossing a certain line. So how to express upcrossing and downcrossing? It is also very simple, we only need to compare the price positions of two moments to judge.
I'm going to show you by the previous picture.
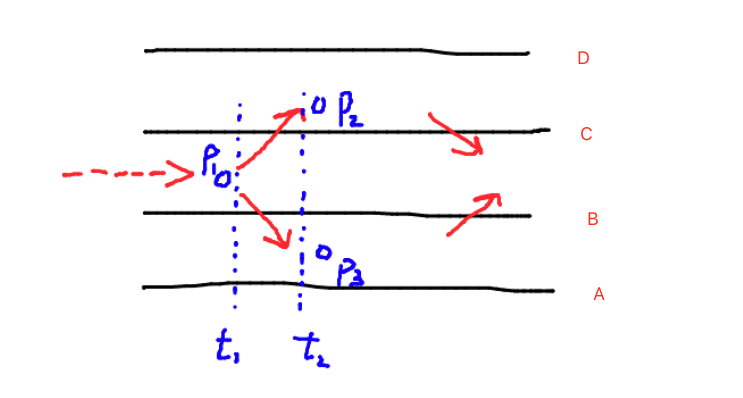
1 is a time, t2 is a time after t1; to judge whether the line C is up crossed or not, we only need to judge
P1 < CandP2 > C.
In the same way, to judge whether the line B is down crossed, we only need to judgeP1 > BandP3 < B.
At that time, we only need to traverse each line in the grid array (traversing is commonly said to be checking one by one), and judge whether up cross or down cross. Is it very simple?I have caught the action of the price upcrossing and downcrossing. Can I place an order when these actions are triggered?
Obviously it is not possible. If the price goes up and down repeatedly on one line, wouldn't it waste the handling fee for repeated trades at the same price? Therefore, there are still a series of judgment conditions after triggering the upcross and downcross, which requires the use of the buy/sell mark in the grid line data structure we just constructed (for example: {"buy":false,"sell ":false,"price":5}).
Thank you for reading, and let's continue the explanation and study in next article.
- 1