
Novice, Check it Out —— Take You to Cryptocurrency Quantitative Trading (7)
In the last article, we have thought and designed a simple multi-symbol grid strategy together. Next, we will continue to learn and move forward on the road of quantitative trading. In this article, we will discuss a more complicated strategy design - the design of hedge strategy. The article plans to design a multi-symbol cross-period hedge strategy. When it comes to cross-period hedge strategy, those who are familiar with futures trading must be familiar with it. For beginners, you may not understand these concepts, so let's briefly explain the concepts about cross-period hedge.
Cross-Period Hedge
Generally speaking, cross-period hedge has a contract of making long, and a contract of making short, and waits for three situations (long, short) to close positions at the same: time
- When making long is profitable, making short has a loss, and the profit is more than the loss, close positions; there will be a return after the profit covers the loss.
- When making short is profitable, making long has a loss, and the profit is more than the loss, close positions; there will be a return after the profit covers the loss. (similar)
- When making long is profitable, and making short is also profitable, do not hesitate to close positions!
For other situations when there are floating losses, you can hold on or continue to add more positions. (because the spread fluctuation is slighter than the single sided fluctuation, the risk will be smaller, but notice that is only comparative!)
Set A1 as the price of contract A at the time 1, and set B1 as the price of contract B at the time 1. At the time, do short in contract A, at A1; do long in contract B, at B1.
Set A2 as the price of contract A at the time 2, and set B2 as the price of contract B at the time 2. At the time, close positions (close short) of contract A, at A2; close positions (close long) of contract B, at B2.
Spread at time 1: A1 - B1 = X
Spread at time 2: A2 - B2 = Y
X - Y = A1 - B1 - (A2 - B2)
X - Y = A1 - B1 - A2 + B2
X - Y = A1 - A2 + B2 - B1
As you can see, "A1 - A2 " is the profit spread of closing position in contract A.
"B2 - B1" is the profit spread of closing position in contract B. It is profitable, as long as the closing postion spread of the two contracts is a positive number, namely A1 - A2 + B2 - B1 > 0. That is to say as long as X - Y > 0,
for: X - Y = A1 - A2 + B2 - B1
It is concluded that as long as the spread X when opening a position is greater than the spread Y when closing a position, it is profitable (note that it is making short in contract A and making long in contract B to open a position; if the situation is reversed, the result will be opposite). Of course, this is just theoretical, and factors such as the handling fee and slippoint should also be considered in practice.
Because cryptocurrency platforms have both delivery contracts and perpetual contracts. And the price of perpetual contracts is always close to the spot price due to the funding rate. Then we choose to use delivery contracts and perpetual contracts to do hedge and arbitrage. For the delivery contract, we can choose one with a comparatively long period, so that the hedging contract does not need to be set frequently.
Warm up by Some Multi-Symbol Spread Statistics
After you are familiar with the basic principle, you don't have to rush into writing the strategy. First, make spread statistics, plot charts, and observe the spreads. Let's learn about multi-symbol strategy plotting together.
We design it based on OKEX contract. It is very easy to plot on FMZ, and you only need to use the encapsulated function, with the chart library Highcharts. The plotting function description in the API documentation: https://www.fmz.com/api#chart...
Since it is a multi-symbol strategy, first of all, it is necessary to determine the price spread of those symbols before plotting. In the code, write two arrays first, representing the contracts to be done.
            var arrSwapContractType = ["BTC-USDT-SWAP", "LTC-USDT-SWAP", "ETH-USDT-SWAP", "ETC-USDT-SWAP"]   // perpetual contract
var arrDeliveryContractType = ["BTC-USDT-210924", "LTC-USDT-210924", "ETH-USDT-210924", "ETC-USDT-210924"]  // delivery contract
According to the contract code set here, initialize the chart configuration. The chart configuration cannot be written in an infinite loop, because you don't know what symbol to do, and how many symbols to do (which are determined according to the values of arrDeliveryContractType and arrSwapContractType), so the chart configuration is returned by one function.
            function createCfg(symbol) {
    var cfg = {
        extension: {
            // it is not part of the group, and is individually displayed; the default is 'group'
            layout: 'single',
            // the specified height, which can be set as string; "300px", which means it will be replaced by "300px" automatically through setting a value of 300
            height: 300,
            // the occupied unit value of the specified width, with a total value of 12
            col: 6
        },
        title: {
            text: symbol
        },
        xAxis: {
            type: 'datetime'
        },
        series: [{
            name: 'plus',
            data: []
        }]
    }

    return cfg
}

function main() {
    // declare arrCfg
    var arrCfg = []                                    // declare an array to store the chart configuration information
    _.each(arrSwapContractType, function(ct) {         // iteratively record the array of perpetual contract codes, pass the "XXX-USDT" part of the contract name as a parameter to the "createCfg" function, construct the chart configuration information, and return
        arrCfg.push(createCfg(formatSymbol(ct)[0]))    // the chart configuration information "push" returned by "createCfg" is in the "arrCfg" array
    })
    var objCharts = Chart(arrCfg)                      // call the function Chart on FMZ platform, and create a chart controlled object called objCharts
    objCharts.reset()                                  // initialize the chart content

    // the rest is omitted...
}
We are going to prepare the data; we use the aggregated market interface of OKEX contract:
USDT perpetual contract:
https://www.okex.com/api/v5/market/tickers?instType=SWAP
USDT delivery contract:
https://www.okex.com/api/v5/market/tickers?instType=FUTURES
Here we write a function to deal with the invocation of the two interfaces, and process the data into one format:
            function getTickers(url) {
    var ret = []
    try {
        var arr = JSON.parse(HttpQuery(url)).data
        _.each(arr, function(ele) {
            ret.push({
                bid1: parseFloat(ele.bidPx),             // buy one price
                bid1Vol: parseFloat(ele.bidSz),          // volume of buy one price
                ask1: parseFloat(ele.askPx),             // ell one price
                ask1Vol: parseFloat(ele.askSz),          // volume of sell one price
                symbol: formatSymbol(ele.instId)[0],     // in the format of trading pair
                type: "Futures",                         // type
                originalSymbol: ele.instId               // original contract code
            })
        })
    } catch (e) {
        return null
    }
    return ret
}
Write one more function to process the contract code.
            function formatSymbol(originalSymbol) {
    var arr = originalSymbol.split("-")
    return [arr[0] + "_" + arr[1], arr[0], arr[1]]
}
Next, we only need to iterate and match the obtained data, calculate the spreads, and plot charts to export, etc.
Here we tested the spread of the next quarter contract 210924 and the perpetual contract.
Complete code:
            // temporary parameters
var arrSwapContractType = ["BTC-USDT-SWAP", "LTC-USDT-SWAP", "ETH-USDT-SWAP", "ETC-USDT-SWAP"]
var arrDeliveryContractType = ["BTC-USDT-210924", "LTC-USDT-210924", "ETH-USDT-210924", "ETC-USDT-210924"]
var interval = 2000

function createCfg(symbol) {
    var cfg = {
        extension: {
            // it is not part of the group, and is individually displayed; the default is 'group'
            layout: 'single',
            // the specified height, which can be set as string; "300px", which means it will be replaced by "300px" automatically through setting a value of 300
            height: 300,
            // the occupied unit value of the specified width, with a total value of 12
            col: 6
        },
        title: {
            text: symbol
        },
        xAxis: {
            type: 'datetime'
        },
        series: [{
            name: 'plus',
            data: []
        }]
    }

    return cfg
}

function formatSymbol(originalSymbol) {
    var arr = originalSymbol.split("-")
    return [arr[0] + "_" + arr[1], arr[0], arr[1]]
}

function getTickers(url) {
    var ret = []
    try {
        var arr = JSON.parse(HttpQuery(url)).data
        _.each(arr, function(ele) {
            ret.push({
                bid1: parseFloat(ele.bidPx),
                bid1Vol: parseFloat(ele.bidSz),
                ask1: parseFloat(ele.askPx),
                ask1Vol: parseFloat(ele.askSz),
                symbol: formatSymbol(ele.instId)[0],
                type: "Futures",
                originalSymbol: ele.instId
            })
        })
    } catch (e) {
        return null
    }
    return ret
}

function main() {
    // declare arrCfg
    var arrCfg = []
    _.each(arrSwapContractType, function(ct) {
        arrCfg.push(createCfg(formatSymbol(ct)[0]))
    })
    var objCharts = Chart(arrCfg)
    objCharts.reset()

    while (true) {
        // obtain the market quote data
        var deliveryTickers = getTickers("https://www.okex.com/api/v5/market/tickers?instType=FUTURES")
        var swapTickers = getTickers("https://www.okex.com/api/v5/market/tickers?instType=SWAP")
        if (!deliveryTickers || !swapTickers) {
            Sleep(2000)
            continue
        }

        var tbl = {
            type : "table",
            title : "delivery-perpetual spread",
            cols : ["trading pair", "delivery", "perpetual", "positive hedge", "negative hedge"],
            rows : []
        }

        var subscribeDeliveryTickers = []
        var subscribeSwapTickers = []
        _.each(deliveryTickers, function(deliveryTicker) {
            _.each(arrDeliveryContractType, function(symbol) {
                if (deliveryTicker.originalSymbol == symbol) {
                    subscribeDeliveryTickers.push(deliveryTicker)
                }
            })
        })
        _.each(swapTickers, function(swapTicker) {
            _.each(arrSwapContractType, function(symbol) {
                if (swapTicker.originalSymbol == symbol) {
                    subscribeSwapTickers.push(swapTicker)
                }
            })
        })

        var pairs = []
        var ts = new Date().getTime()
        _.each(subscribeDeliveryTickers, function(deliveryTicker) {
            _.each(subscribeSwapTickers, function(swapTicker) {
                if (deliveryTicker.symbol == swapTicker.symbol) {
                    var pair = {symbol: swapTicker.symbol, swapTicker: swapTicker, deliveryTicker: deliveryTicker, plusDiff: deliveryTicker.bid1 - swapTicker.ask1, minusDiff: deliveryTicker.ask1 - swapTicker.bid1}
                    pairs.push(pair)
                    tbl.rows.push([pair.symbol, deliveryTicker.originalSymbol, swapTicker.originalSymbol, pair.plusDiff, pair.minusDiff])
                    for (var i = 0 ; i < arrCfg.length ; i++) {
                        if (arrCfg[i].title.text == pair.symbol) {
                            objCharts.add([i, [ts, pair.plusDiff]])
                        }
                    }
                }
            })
        })

        LogStatus(_D(), "\n`" + JSON.stringify(tbl) + "`")
        Sleep(interval)
    }
}
Bot Operation
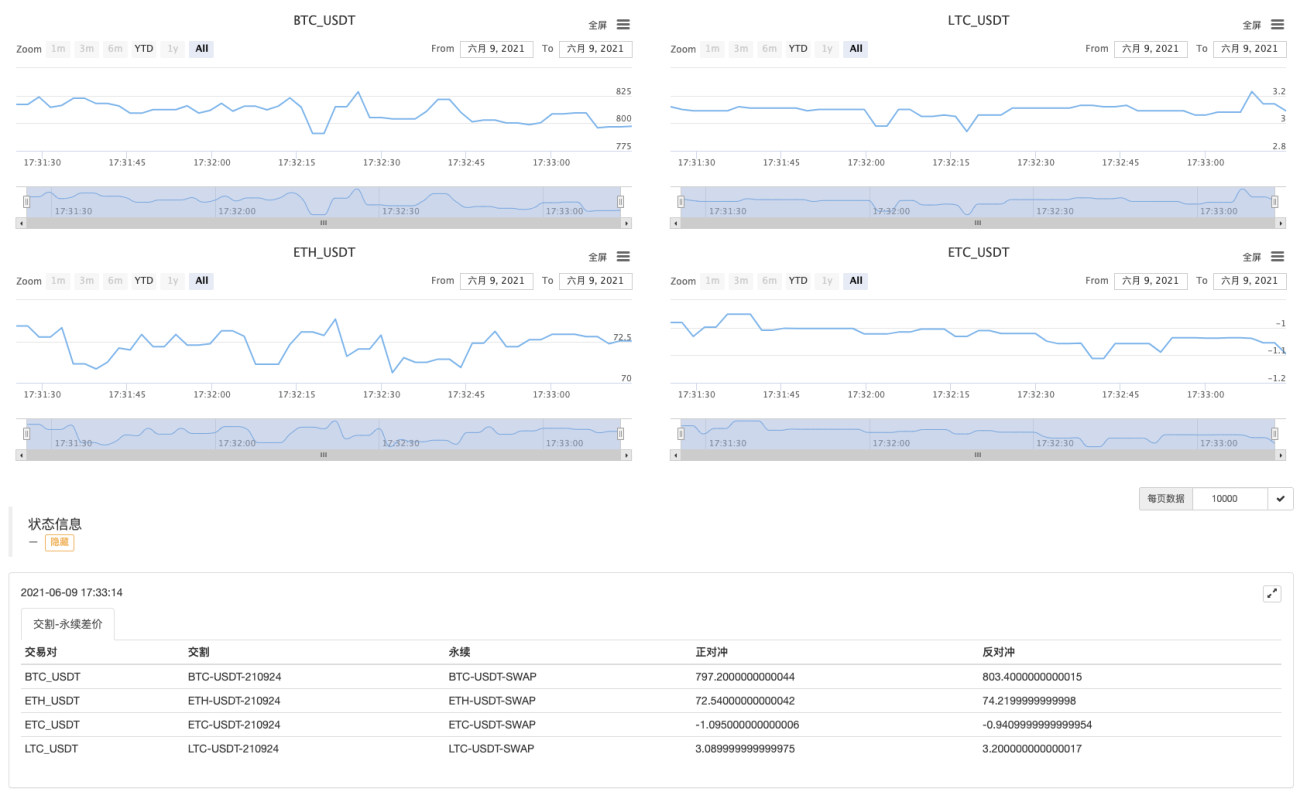
Run for a while.
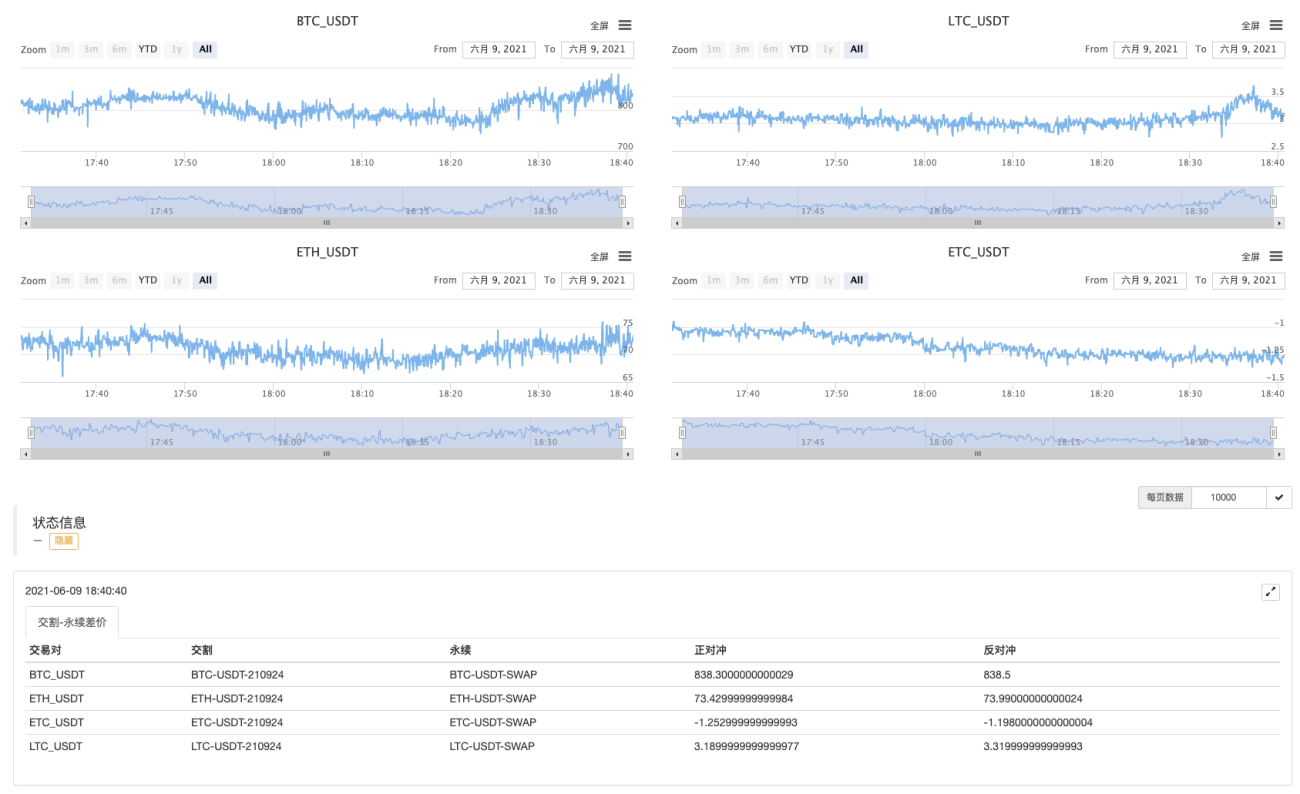
Observe the spreads first!
- 1