

Hello! Welcome to my channel!
Welcome all traders to my channel. Thanks to the FMZ platform, I will share more content related to quantitative development, and work with all traders to maintain the prosperity of the quantitative community.
Do you still not know the position of the market?
Are you feeling anxious before getting in the market?
Are you wondering whether you should sell coins in the market?
Have you watched various "teachers" and "experts" give guidance?
Please don't forget that we are Quant, we use data analysis, and we speak objectively!
Today, I am here to introduce some of my fundamental quantitative analysis research in the cryptocurrency market. Every week we will monitor a large number of comprehensive fundamental quantitative indicators, display the current market situation objectively, and propose hypothetical future expectations. We will describe the market comprehensively from macro fundamental data, capital inflows and outflows, exchange data, derivatives and market data, and numerous quantitative indicators (on-chain, miners, etc.). Bitcoin has a strong cyclical and logical nature, and many reference directions can be found by learning from history. More fundamental data indicator updates are being collected!
I. Macro Fundamental Data
1. Industry market value and proportion
The total market value of cryptocurrency has reached around US$2.5 trillion, which is still one step away from breaking through the previous high. Under the historical background that Bitcoin has broken through the previous high, if another surge brings about a breakthrough in the total market value, then it will be possible a new round of bull market is approaching for the industry as a whole. At the same time, Bitcoin's share remains at about 50%, which is lower than the previous bull market about 60% of 2021. In addition, due to the recent impact of ETFs, Bitcoin is actually the hottest product in the market, and its market share is still stable every round as the bull market declines, I believe that various projects in the crypto industry other than Bitcoin are receiving more financial attention. If the bull market develops further, Bitcoin's share may begin to decline, and more funds will pour into various sectors and varieties.
2. Money supply from the world's four major central banks
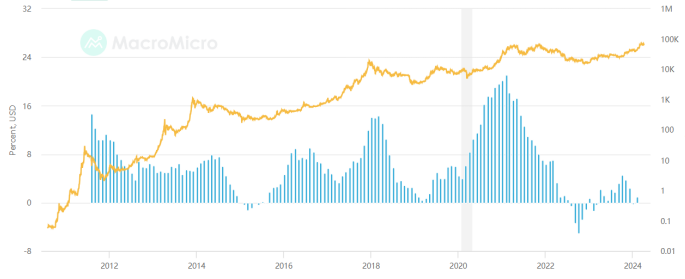
Let's look at the M2 money supply of the world's four major central banks (the United States, Europe, Japan, and China), which represents the amount of legal currency funds in the market. Compared with legal currencies that can be created in large quantities, Bitcoin has the characteristics of "limited supply". The purpose of its creation in 2008 is to help ordinary people resist the depreciating legal currency wealth. When the money supply of the four major central banks continues to rise, it may strengthen market doubts about the value of legal currency, which is beneficial to the trend of Bitcoin; conversely, when global monetary policy begins to tighten, it is detrimental to the trend of Bitcoin. It can be seen that when Bitcoin reached a new high in this round, the annual increase in the supply of the four major global currency central banks was still at a low level of 0.94%. Therefore, we should think about whether more funds will flow into the industry if monetary policy does not change. If the money supply surges, Bitcoin will have greater upside space.
II. Capital Inflow and Outflow
1. Bitcoin ETF
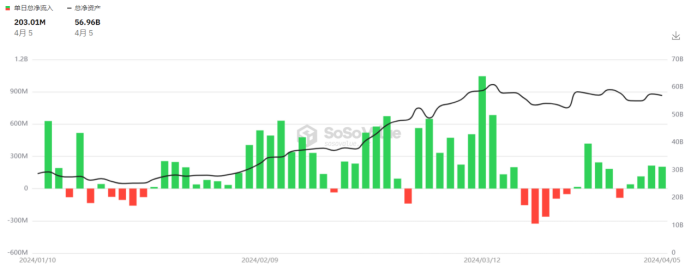
Bitcoin ETF capital inflows are on the high side, and the total assets of ETFs have reached 56B, which is correlated with the price of Bitcoin. We need to continue to monitor the inflow and outflow trends of ETFs.
2. USD stablecoin
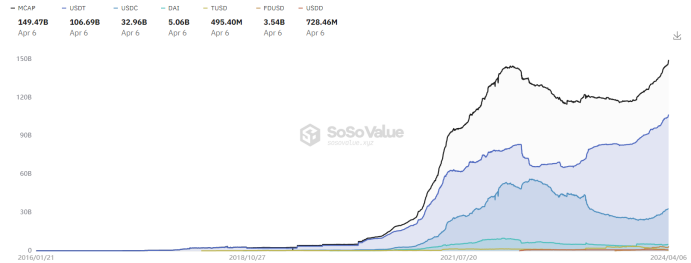
The total market value of U.S. dollar stablecoins has reached 150B, USDT has steadily ranked first in market share, and the supply of stablecoins has exceeded a record high, indicating that Bitcoin's record high has strong support from the U.S. dollar. We need to continue to observe the number of dollars. Only with dollars can we have prices.
III. Exchange Inflow and Outflow Data
1. Exchange token reserves
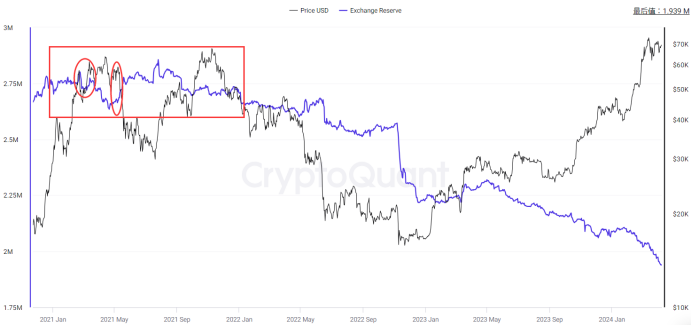
Let's look at the exchange Bitcoin reserve data, defined as the total amount of tokens held on exchange addresses. Total exchange reserves are a measure of a market's sales potential. As reserve values continue to rise, for spot trades, high values indicate increasing selling pressure. For derivatives trading, high values indicate the potential for high volatility. It can be seen that Bitcoin has reached new highs recently and exchange Bitcoin reserves have been declining, which is still a healthy signal. Normal value-added activities will deposit the tokens into the wallet. Only spot sales or trading activities will deposit tokens into the exchange. I think that exchange token reserves need to be monitored at all times to guard against rising exchange reserves and long-term side effects. If the price rises or fluctuates at a high level, it will show a peaking signal.
2. Inflow and outflow of exchange tokens
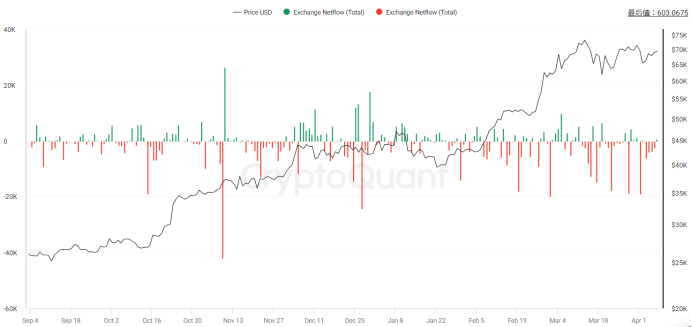
We further observe the net inflow and outflow of exchanges. Exchange inflow refers to the action of depositing a certain amount of cryptocurrency into the exchange wallet, while outflow refers to the action of withdrawing a certain amount of cryptocurrency from the exchange wallet. Exchange net flow is the difference between BTC flowing in and out of the exchange. Increased inflows into exchanges could mean selling from individual wallets, including whales, indicating selling power. On the other hand, an increase in exchange outflows could mean traders are increasing HODL positions in order to hold the coin in their wallets, indicating buying power. A positive trend in exchange inflows or outflows can indicate an increase in overall exchange activity, meaning more and more users are using the exchange to trade actively. This could mean that trader sentiment is at a bullish moment. Observations have found that exchange outflows have been high recently, and both inflows and outflows have been relatively stable. We need to monitor inflow and outflow data at all times and beware of large inflows and outflows that far exceed the average volume standard deviation, which will indicate important market trading behavior and the steering happens slowly.
IV. Derivatives and Market Trading Behavior
1. Perpetual funding rate
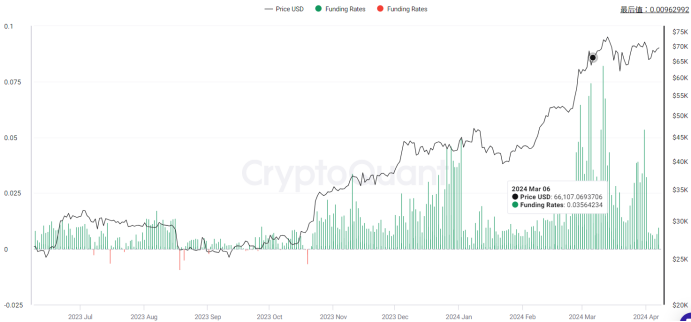
Funding rate is the fee periodically paid by long or short traders based on the difference between perpetual contract market and spot prices. It helps perpetual contract prices converge to the index price. All cryptocurrency derivatives exchanges use funding rates for perpetual contracts, denoted as a percentage for a given period and exchange rate. Funding rates reflect traders' sentiment towards positions in the perpetual swap market. A positive funding rate implies bullish sentiment, with long traders paying funding to short traders. Conversely, a negative funding rate suggests bearish sentiment, with short traders paying funding to long traders.
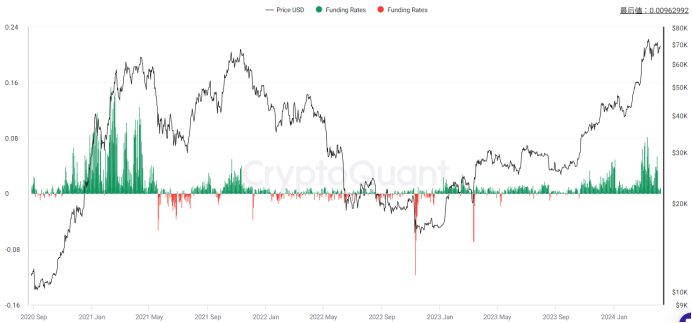
As prices rise, the current Bitcoin funding rate has significantly increased, peaking at 0.1%, indicating short-term market fervor, but gradually declining. Looking at the long term, there is still a gap compared to the funding rate during the comprehensive bull market in 2021. From the funding rate perspective alone, I believe it is far from a long-term peak. We need to monitor funding rates constantly, paying attention to extreme rates and whether they are close to historical highs. Specifically, I emphasize observing deviations between funding rates and prices; if prices continue to make new highs while funding rates peak lower than previous highs, it indicates overvaluation in the market and insufficient support, if this scenario occur, it would signal a market top.
2. The long-short ratio of the entire network
Let's look at the long-short position ratio of the exchange. The purpose of this data is to allow everyone to see the tendencies of retail investors and large investors. It is known that the total position value of long and short positions in the market is equal. The total position value is equal, but the number of holders is different, it means that the party with more holders has a smaller per capita position value and is dominated by retail investors, while the other party is dominated by large investors and institutions. When the ratio of long-short positions reaches a certain level, it means that retail investors tend to be bullish, while institutions and large investors tend to be bearish. Personally, I think this data mainly observes the inconsistency between the overall long-short ratio and the long-short ratio of large investors. It is currently relatively stable and there is no obvious signal.
V. Quantitative Indicators
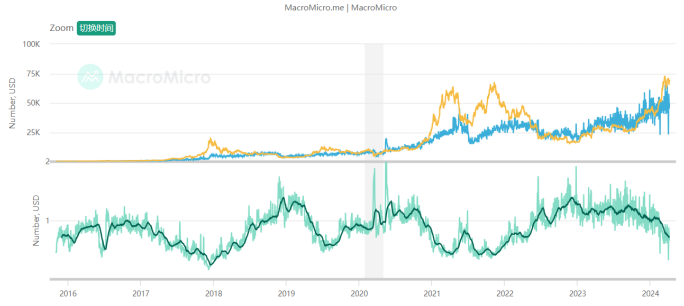
1. MAVR ratio
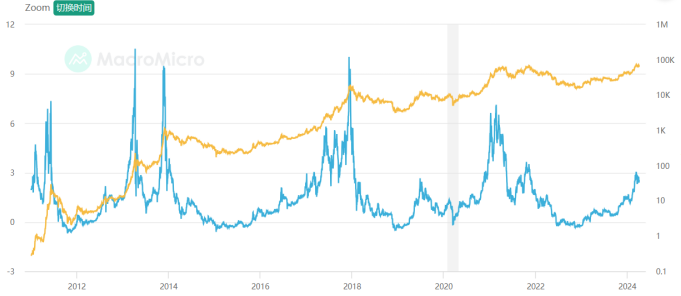
Definition: The MVRV-Z score is a relative indicator, which is the "circulating market value" of Bitcoin minus the "realized market value", and then standardized by the standard of the circulating market value. The formula is: MVRV-Z Score = (circulating market value - realized market value) / Standard Deviation. The "realized market value" is based on the value of transactions on the Bitcoin chain, calculating the sum of the "last movement value" of all Bitcoins on the chain. Therefore, when this indicator is too high, it means that the market value of Bitcoin is overvalued relative to its actual value, which is detrimental to the price of Bitcoin; otherwise, it means that the market value of Bitcoin is undervalued. According to past historical experience, when this indicator is at a historical high, the probability of a downward trend in Bitcoin prices increases, and attention should be paid to the risks of chasing higher prices.
Explanation: In short, it is used to observe the average cost of chips across the entire network. Generally, the low level is less than 1 and is of great concern. At this time, buying is lower than the cost of chips for most people, and there is a price advantage. Generally, a high of around 3 is already very hot and is a suitable range for short-term chip selling. At present, Bitcoin MVRV has increased a lot and has gradually entered the selling range, but there is still a little room to prepare a gradual selling plan. Referring to the historical decline, I personally think that it is a better position to start selling around MVRV3.
2. Puell multiplier
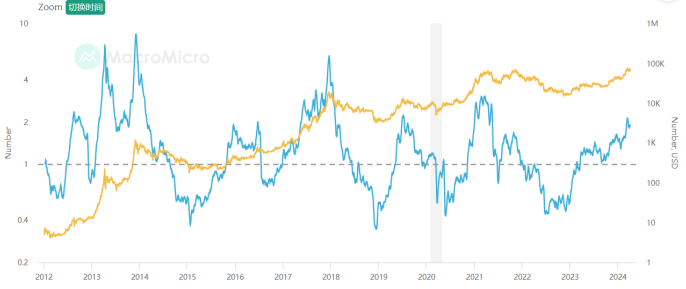
Definition: The Puell multiplier calculates "the ratio of current miner revenue to the average of the past 365 days", where miner revenue is mainly the market value of newly issued Bitcoins (new Bitcoin supply will be obtained by miners) and related transaction fees, available to estimate the income of miners, the formula is as follows: Puell multiplier = miner income (market value of newly issued Bitcoins) / 365-day moving average miner income (all in US dollars). Selling mined Bitcoins is the main revenue for miners, used to supplement the capital investment in mining equipment and electricity costs during the mining process. Therefore, the average miner income in the past period can be indirectly regarded as the minimum threshold to maintain the opportunity cost of miners' operations. If the Puell multiplier is much lower than 1, it means that miners have insufficient momentum for profit growth, so their motivation to further expand investment in mining is reduced; conversely, if the Puell multiplier is greater than 1, it means that miners still have the momentum for profit growth and will expand investment in mining motivation.
Explanation: The current Puell multiplier is high, greater than 1 and close to the historical high value. Considering the attenuation of extreme values in each round of bull market, we should start to consider a gradual selling plan.
3. Transfer fee per transaction in USD
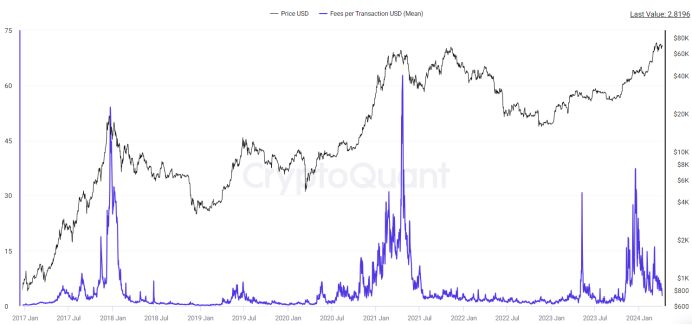
Definition: The average fee per transaction, in USD.
Explanation: We need to pay attention to extreme transfer fees. Every transfer on the chain is meaningful. Extreme transfer fees represent urgent large-scale actions. Historically, they are an important reference for the top. Currently, there have been no overly exaggerated single transfer fees.
4. Number of addresses of large Bitcoin retail investors
Definition: From the distribution of addresses holding the number of Bitcoins, we can roughly know the trend of Bitcoin holdings. We divided retail investors (holding less than 10 Bitcoins) and large investors (holding more than 1,000 Bitcoins) to calculate the "Bitcoin retail investors/large account number address ratio". When the ratio rises, it means that the number of retail investors holding Bitcoin has increased. At the end of the bull market, large Bitcoin investors will distribute chips to more retail investors, and the rising trend of Bitcoin prices is relatively loose; on the contrary, it means that the Bitcoin price increase is relatively stable.
Explanation: Continuous monitoring is required. When large investors continue to distribute chips to retail investors, they can consider gradually withdrawing.
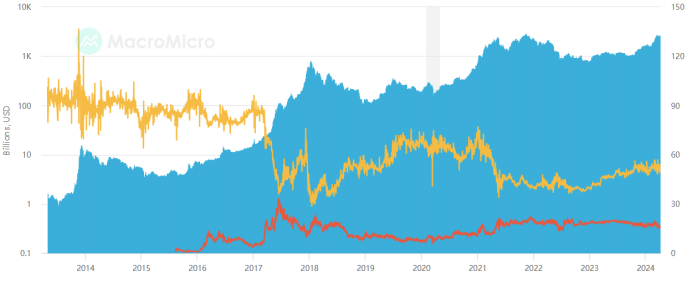
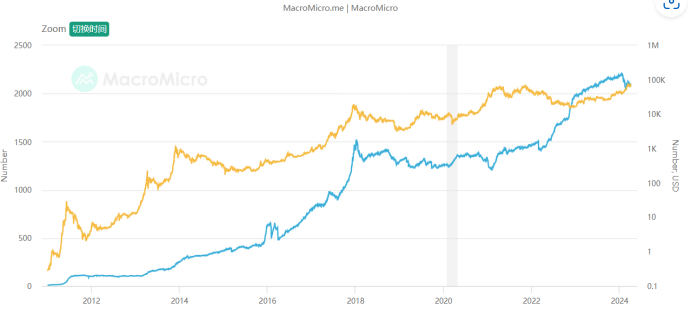
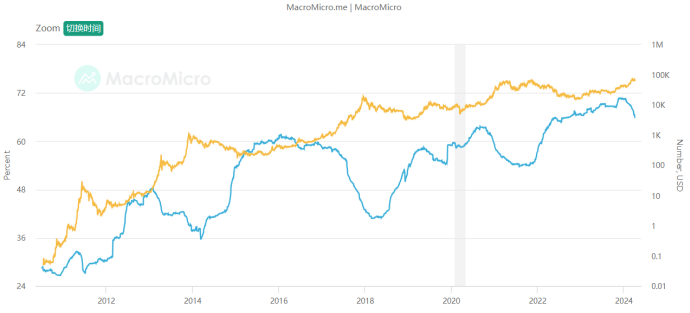
5. Bitcoin mining cost
Definition: Based on the global Bitcoin "power consumption" and "daily number of new issuances", the average cost of producing each Bitcoin by all miners can be estimated. When the price of Bitcoin is greater than the production cost and miners are profitable, mining equipment may be expanded or more new miners may join, leading to an increase in mining difficulty and production costs; conversely, when the price of Bitcoin is lower than the production cost , miners reduce their scale or quit, which will reduce the difficulty of mining and reduce production costs. In the long term, Bitcoin prices and production costs will follow a step-by-step trend through market mechanisms, because when there is a gap between prices and costs, miners will join/exit the market, causing prices and costs to converge.
Explanation: We need to focus on the ratio of the mining cost of each Bitcoin to the market price. This indicator shows a mean reversion state, reflecting the fluctuation and regression of the relative value of the price, which is of great long-term timing significance! The ratio fluctuates around 1, and is currently lower than 1, indicating that the price has begun to be overvalued relative to value, and it is gradually approaching historical lows to start exiting.
6. Long-term dormant currency age ratio
Definition: This indicator counts the total number of Bitcoins whose most recent transaction was more than one year ago. When the indicator value is larger, it means that more shares of Bitcoin are held for the long term, which is beneficial to the cryptocurrency market; conversely, it means that more shares of Bitcoin are traded, which may reveal that large investors are taking profits, which is detrimental to market performance. Based on the experience of the past several Bitcoin bull market periods, the downward trend of this indicator usually precedes the end of the Bitcoin bull market. When this indicator is at a historically low level, it is more likely to be the end of the Bitcoin bull market, so it can be judged as a leading indicator that Bitcoin is getting off the market.
Explanation: As the bull market progresses, more and more dormant Bitcoins begin to recover and trade. We need to pay attention to the stability of the downward trend of this value, showing the characteristics of a top. It has not yet started to plateau after the decline.
7. Ratio of long and short currency ages
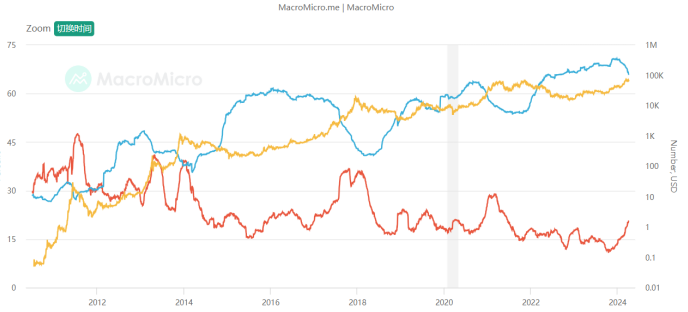
Definition: Bitcoin three-month transaction ratio statistics the proportion of all Bitcoins that have been recently traded within the last three months, calculating the ratio of Bitcoins traded within the last three months to the total number of Bitcoins. When the indicator trends upwards, it signifies a larger proportion of Bitcoins have been traded in the short term, increasing turnover frequency, indicating sufficient market activity. Conversely, when this indicator trends downwards, it indicates a decrease in short-term turnover frequency. Bitcoin over one year without transaction ratio statistics the proportion of all Bitcoins that have not been traded within the last year, calculating the ratio of Bitcoins not traded for over one year to the total number of Bitcoins. When this indicator trends upwards, it represents an increase in the proportion of Bitcoins that have not been traded for a long time, indicating an increase in long-term holding intentions. When this indicator trends downwards, it signifies a decrease in the proportion of Bitcoins that have not been traded for a long time, indicating the release of originally long-held Bitcoin chips.
Explanation: The indicator focuses on the beginning of a plateau in short-term value increases and a decrease in long-term value, indicating characteristics of a top. Currently, there is a long-term decrease and a short-term increase, indicating overall relatively healthy conditions.
VI. Summary
In one sentence, we are currently in the middle of the bull market, and many indicators are performing well. However, overheating should be gradually taken into consideration, and we can start to formulate an exit plan, and gradually exit when one or more fundamental quantitative indicators begin to not support the bull market. Of course, these are just some representatives of fundamental quantitative analysis. I will integrate and collect more fundamental quantitative research systems in the currency circle in the future. Welcome to pay attention and discuss together!
We are Quant, we use data analysis, we no longer have to believe in all kinds of bullshit, we use objectivity to construct and revise our expectations!
- 1