
Summary
Parabolic steering is a very strange technical analysis indicator, invented by Welles Wilder, the full name of the abbreviation is "Stop and Reverse", referred to as "SAR". This is a very simple and also very popular mid-low frequency trending technical analysis tool. The content of this article develops a strategy based on this technical indicator and the relative positional relationship of price high and low points.
Parabolic Steering Introduction
The parabolic turn is peculiar because its external shape is different from other indicators. It consists of red or green dots and follows the price movement in an arc shape. Because it is shaped like a parabola on the chart, we call it parabolic steering, but it actually doesn't involve any mathematical calculation of the parabola.
It is built on top of the price chart and is mainly used to analyze price trends. This is similar to the moving average line. The only difference is that it comes with an acceleration factor that adjusts its speed as the price changes.
In addition, the moving average will always run through the price, when the price crosses the parabola, the indicator will reverse the “switch”; and its indicated price will appear on the other side of the price level; and will prompt the trader's stop loss position until the market trend ends. When the price is above the parabola, traders should hold long position, when the price is below the parabola, traders should hold short position.
Parabolic Steering Calculation
The calculation of parabolic steering is very complicated. First, you need to determine the extreme point (highest or lowest price EP). Then add an acceleration factor (AF) starting from 0.02 to it, and then add 0.02 each time the next extreme point is touched. The maximum of AF is 0.20, then multiply the difference between the extreme price and the previous period SAR by the acceleration factor, then add the SAR of the previous period.
Price Rising Algorithm
Step 1: Assume that the time period is t. SAR(t) is equal to the lowest price of the previous N time periods. The initial value of Af(t) is 0.02.
-
If
SAR(t)is greater than the lowest priceL(t)of the t period, a switch occurs and enters the downtrend at the next time period; -
If
SAR(t)is not greater than the lowest priceL(t)of the t period, it enters the uptrend at the next time period; -
The extreme value
Ep(t)is equal to the highest price of the last N time periods;
Step 2: The time period is t+1, which is:
SAR(t+1)=SAR(t)+Af(t)*(Ep(t) – SAR(t))
-
If
SAR(t+1)is greater than the lowest priceL(t+1)of the t+1 time period, a switch occurs and enters a downtrend at the next time period; -
If
SAR(t+1)is not greater than the lowest priceL(t+1)of the t+1 time period, it enters the next stage of uptrend; and the extreme valueEp(t+1)is equal to the highest price of the last N time periods; -
If the highest price of the time period, that is,
H(t+1)is higher than the highest price of the previous N time periods, thenAF(t+1)=AF(t)+0.02, otherwise,AF(t+1)= AF(t).
Step 3: repeat the algorithm in the second step of the uptrend in the following time period t+2, t+3, ..., until the switch occurs. In addition, the maximum value of AF is 0.2.
Price Falling Algorithm
Step 1: Assume that the time period is t. SAR(t) is equal to the highest price of the previous N time periods. The initial value of Af(t) is 0.02.
-
If
SAR(t)is less than the highest priceH(t)of the t time period, a switch occurs and enters the uptrend at the next time period; -
If
SAR(t)is not less than the highest priceH(t)of the t time period, it enters the downtrend at the next time period; -
The extreme value
Ep(t)is equal to the lowest price of the last N time periods;
Step 2: The time period is t+1, which is:
SAR(t+1)=SAR(t)+Af(t)*(Ep(t) – SAR(t))
-
If
SAR(t+1)is less than the highest priceH(t+1)of the t+1 period, a switch occurs and enters the uptrend at the next time period; -
If
SAR(t+1)is not less than the highest priceL(t+1)of the t+1 period, it enters the downtrend at the next time period; in addition, the extreme valueEp(t+1)is equal to the lowest price of the last N time periods; -
If the lowest price
L(t+1)of the time period is lower than the lowest price of the previous N time periods, thenAF(t+1)=AF(t)+0.02, otherwise,AF(t+1)=AF (t).
step 3: repeat the algorithm in the second step of the uptrend in the following time period t+2, t+3, ..., until the switch occurs. In addition, the maximum value of AF is 0.2.
There are many versions of the SAR algorithm. The above algorithm is just one of them, others are similar in structure. The difference is in the details, such as the trigger condition of the acceleration factor and the determination algorithm of Ep(t). We can see the characteristics of the parabolic turn: in the rising trend of the market, the SAR of each K line is higher than the SAR of the previous K line, and the stop loss point is gradually moved up, thus ensuring that the floating profit is also gradually moving up. This is the typical trailing stop loss. In the accelerating rising trend of the market, the AF is increased and the EP is increased, which further accelerates the speed of the stop-loss point, ensuring that in a strong trend situation, the stop-loss point can closely follow the trend of the stock price and lock in more gains.
Strategy Logic
Separate parabolic steering is a reversal strategy. When the price is above the parabola, the long position is held, and when the price is below the parabola, the short position is held. This non-empty strategy can adapt to the trend market well and can making a good profit when the market trend is smooth. But those who have done trading know that the market is volatile for most of the time, so if you use the parabolic turn alone, you may lose a lot of the profits you have earned in the long-term trend market. Therefore, we need to add a filter. When the market is volatile, we can filter some of the non-trend opportunities, thus reducing the trading frequency and increasing the winning rate or the profit-loss ratio, so that even in the long-term volatile market, the retreat of net value can be effectively reduced.
-
Long position open: parabola is rising, and the highest price is higher than the previous highest price
-
Short position open: parabola is falling, and the lowest price is lower than the previous lowest price
-
Long position taking profit: the parabola is falling and the floating profit reaches the specified amount
-
Short position taking profit: the parabola is rising and the floating profit reaches the specified amount
-
Long position stop loss: loss reaches the specified amount
-
Short position stop loss: loss reaches the specified amount
Writing Strategy
Based on the above strategy logic, we can implement it on the FMZ Quant platform. Open: fmz.com > Login > Dashboard > Strategy Library > New Strategy > Click on the drop-down menu in the upper right corner to select My Language, start writing the strategy, and pay attention to the comments in the code below.
First, the parameters that need to be used in this strategy: the moving average length, the stop loss range, the taking profit parameter, etc. These are all defined as external parameters to facilitate test debugging and optimization:
            N:=30; // highest or lowest price parameter
SLOSS:=1; // Taking Profit and Stop Loss Coefficient
FUND:=100000; // Initial funds
Then, calculate the necessary data used in the strategy: first calculate the order quantity, then calculate the parabolic turn indicator, and judge whether it is a rising state or a falling state, and finally calculate the positional relationship between the highest or lowest price and the previous highest and lowest price:
            LOTS:=MAX(1,INTPART(FUND/(O*UNIT*0.1))); // Calculate the order quantity
SARLINE:=SAR(4,2,20); // Calculate the parabolic turn indicator
B1:=SARLINE>0; // Determine whether the trend is rising
S1:=SARLINE<0; // Determine whether the trend is falling
B2:=HIGH>=HHV(CLOSE,N); // Determine if the highest price is greater than the previous highest price
S2:=LOW<=LLV(CLOSE,N); // Determine if the lowest price is less than the previous lowest price
The following part are about the opening position and stop-loss or taking-profit:
            BARPOS>N AND B1 AND B2,BK(LOTS); //Open long position
BARPOS>N AND S1 AND S2,SK(LOTS); // Open short position
S1 AND S2 AND BKHIGH>BKPRICE*(1+0.01*SLOSS), SP(BKVOL); // Long position taking profit
B1 AND B2 AND SKLOW<SKPRICE*(1-0.01*SLOSS),BP(SKVOL); // Short position taking profit
C<BKPRICE*(1-SLOSS*0.01), SP(BKVOL); // Long position stop loss
C>SKPRICE*(1+SLOSS*0.01), BP(SKVOL); // Short position stop loss
Strategy Backtest
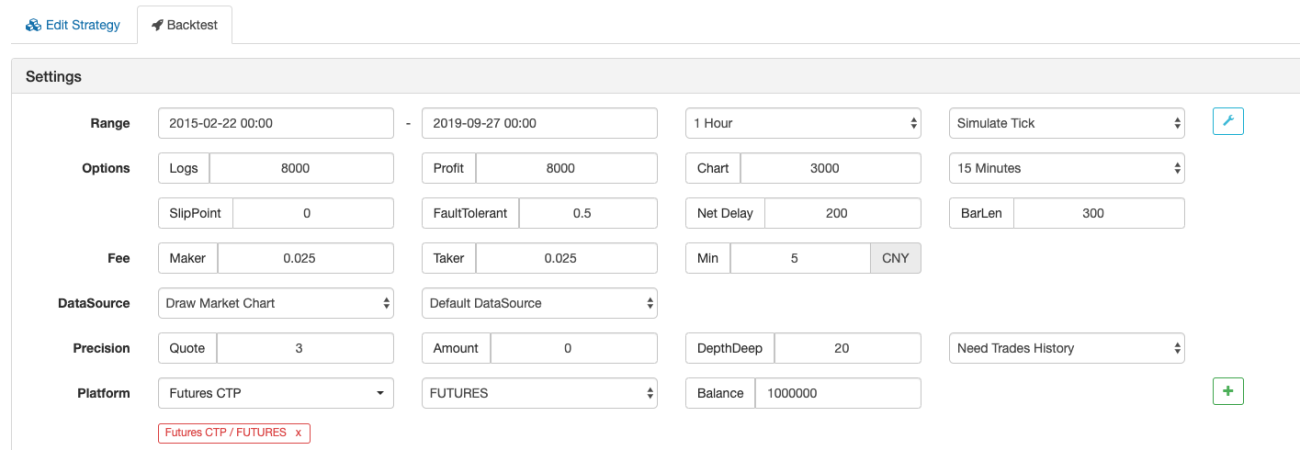
Backtest Environment
- Trading variety: rebar index
- Time: February 22, 2015 ~ September 27, 2019
- Cycle: one hour
- Slippage: 2 pips for opening and closing positions
- Fee: 2 times of the exchange standard
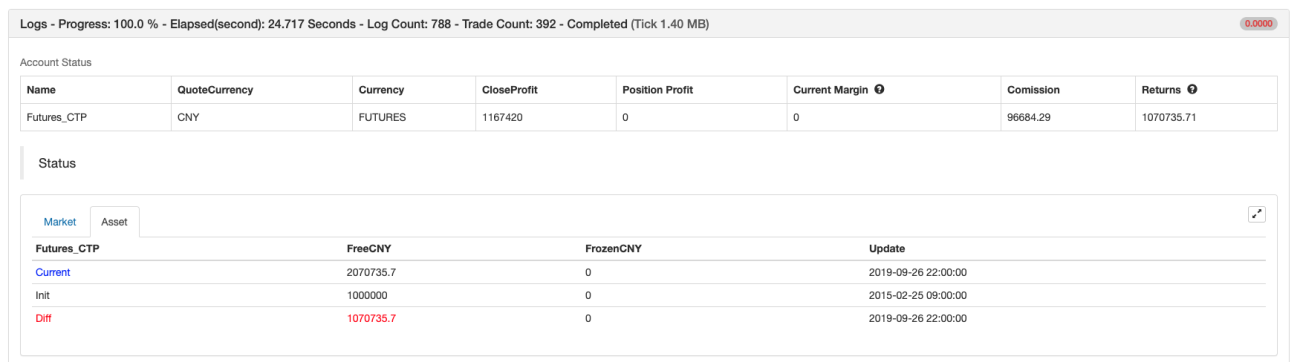
Profit Report
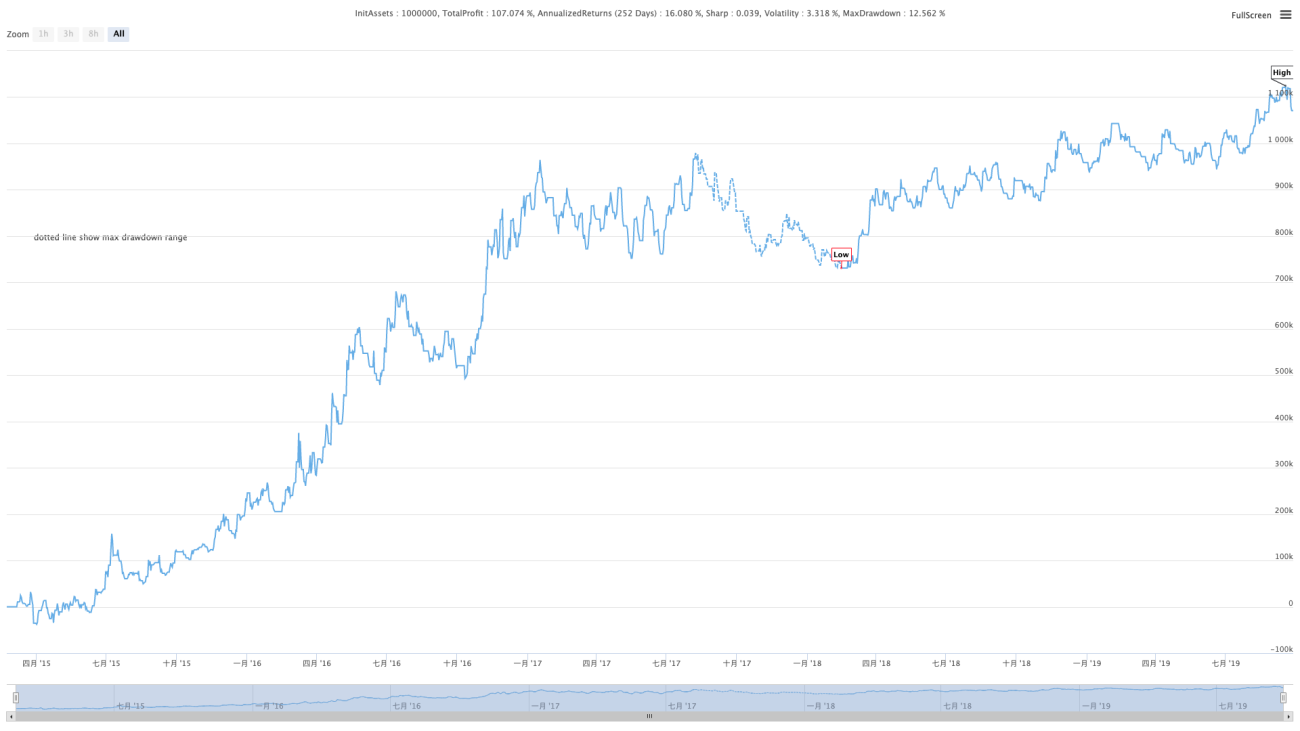
Fund Curve
Complete Strategy Code
            (*backtest
Start: 2015-02-22 00:00:00
End: 2019-09-27 00:00:00
Period: 1h
Exchanges: [{"eid":"Futures_CTP","currency":"FUTURES"}]
Args: [["ContractType","rb000",126961]]
*)

N:=30; // Highest or lowest price parameter
SLOSS:=1; // Take Profit and Stop Loss Coefficient
FUND:=100000; // Initial funds

LOTS:=MAX(1,INTPART(FUND/(O*UNIT*0.1))); // Calculate the order quantity
SARLINE:=SAR(4,2,20); // Calculate the parabolic turn indicator
B1:=SARLINE>0; // Determine whether the trend is rising
S1:=SARLINE<0; // Determine whether the trend is falling
B2:=HIGH>=HHV(CLOSE,N); // Determine if the highest price is greater than the previous highest price
S2:=LOW<=LLV(CLOSE,N); // Determine if the lowest price is less than the previous lowest price

BARPOS>N AND B1 AND B2,BK(LOTS); //Open long position
BARPOS>N AND S1 AND S2,SK(LOTS); // Open short position
S1 AND S2 AND BKHIGH>BKPRICE*(1+0.01*SLOSS), SP(BKVOL); // long position taking profit
B1 AND B2 AND SKLOW<SKPRICE*(1-0.01*SLOSS),BP(SKVOL); // short position taking profit
C<BKPRICE*(1-SLOSS*0.01), SP(BKVOL); // long position stop loss
C>SKPRICE*(1+SLOSS*0.01), BP(SKVOL); // short position stop loss
Click to copy the full strategy source code without configuration : https://www.fmz.com/strategy/168073
In The End
Most of the traditional indicators lag far behind the new K line. Not only the parabolic turn can be closely matched to the new K line according to the characteristics of the built-in acceleration factor, but also it is not too flexible, so that the strategy can be both offensive and defensive. Although the calculation method is very complicated, the existing indicators can be used directly, which is very friendly for beginners. However, it should be noted that when the market enters a narrow range of volatility, the parabolic turn will often have an invalid buying and selling signal, which will cause it to expire temporarily or for a long time.
- 1