

About us
This trading system is quantitatively designed by 泊宇量化. we are a team that has been committed to researching quantitative trading strategies for a long time.
Last year, we have achieved a excellent results in the Tokeninsight Quantitative Contest.
Thanks you FMZ community for providing such a platform.
In order to better support the construction of quantitative communities, the design concept and design ideas of this strategy are now publicly published here.
I hope you can learn the design and application of quantitative trading.
The origin of the quantitative rate trading strategy
The inspiration for the quantitative typing rate system is mainly from physics
The definition of speed in physics is: the distance moved per unit time.
If you regard price as distance, then in the financial market, the definition of speed is the size of price change per unit time.
If the price changes greatly in a unit time, such a market is usually called a rapid market; if the price changes in a unit time is small, such a market is called a slow market. Therefore, speed is a natural law that integrates time and price. A deep understanding of speed can help us understand the market to a greater extent.
If the rate increases, it means that the energy is increasing and can effectively predict the upward trend of the market.
If the rate drops, it means energy failure and the risk of flat or falling market conditions can be perceived.
Each transaction uses a certain number of lots for the transaction, so it is called a quantitative type rate trading system.
Knowledge to be prepared
Highest price (HHV): The highest price reached in a specific period.
Lowest price (LLV): The lowest price reached in a specific period.
Moving Average (MA): A line connecting the average closing price of a specific period.
Slope of regression (SLOPE): The slope of a linear regression with a specific period. (That’s what we call rate)
The linear equation OLS slope formula is as follows:
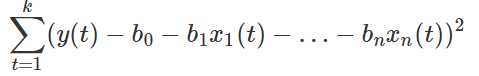
The mathematical formula is very complicated, but the FMZ platform has already written the grammar formula (SLOPE) of the M language for us.
We can see that the algorithm is as follows:
- SLOPE
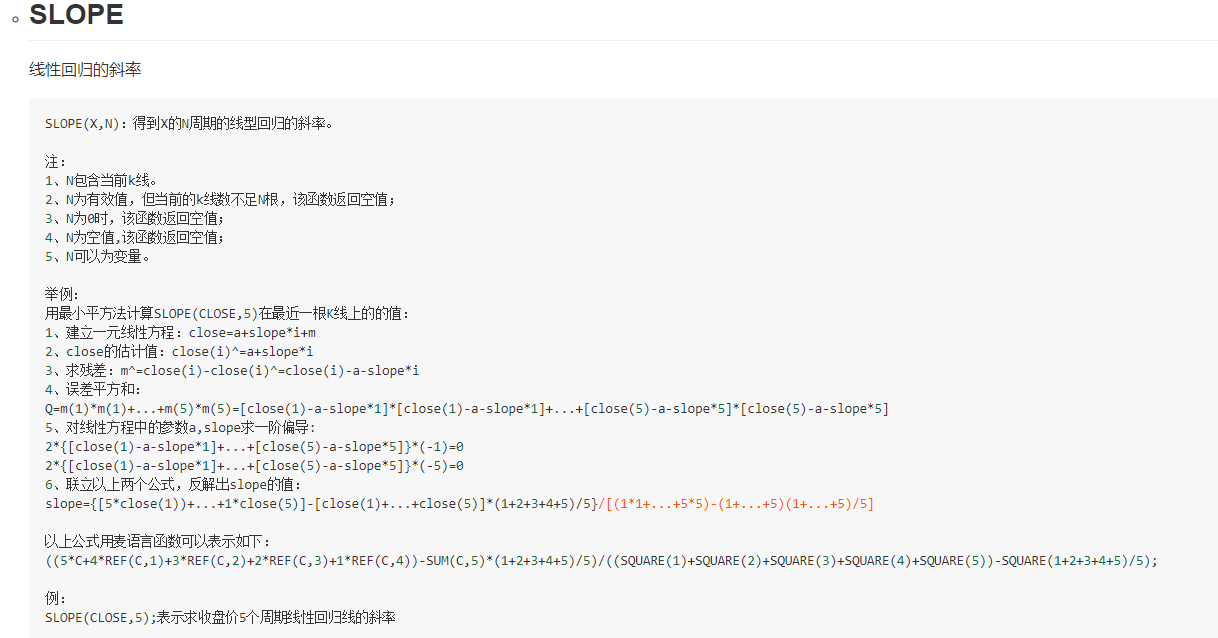
The process is a bit more complicated, but everyone does not have to think about it. Just call the formula directly.
Indicator design:
- First calculate the highest and lowest prices in a certain period of time
- Take the average of these 2 prices
- Calculate a moving average line on the average
- Find the regression slope of the moving average
len:=35;//Design cycles
hh^^HHV(H,len);//Take the highest price in a certain period
ll^^LLV(L,len);//Take the lowest price in a certain period
hl2^^(hh+ll)/2;//Average of highest price and lowest price
avg^^MA(hl2,5);//Calculate the moving average line of the average
ss:SLOPE(avg,len);//Calculate the regression slope of the moving average line
Through the design of indicators, we can see that in the main chart, we have the highest point (yellow line), the lowest point (green line), their average (red line), and the Smoothed price moving average calculated by red line (thick purple line)
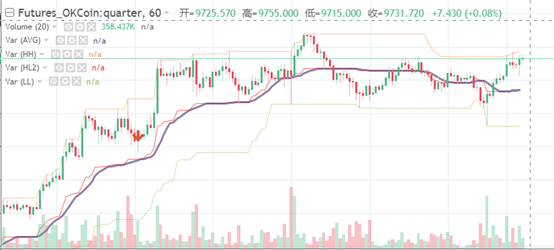
Then we can calculate the regression slope ss in the attached figure, which represents the rising and falling rate of the moving average.
Trading strategy design
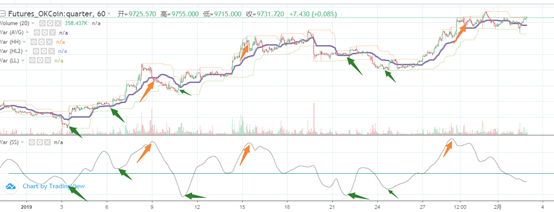
As can be seen from the figure above, the green arrows indicate the inflection points at the lowest slope, and the orange arrows indicate the inflection points at the highest slope.
The reaction along the chart is on the k line, and the weakening of the rise and the weakening of the decline can also be clearly felt.
If you buy and sell at the inflection point, you can effectively operate the trading at the early stage, instead of chasing the rise or the fall at the high or low point.
- The design idea is:
The rising slope means that the market momentum is increasing, which may stop falling or start to rise.
The continuous decline of the slope means that the market momentum is weak, and may stop rising or start to fall.
The design and expression using M language are as follows:
            len:=35;//Design cycles

hh^^HHV(H,len);//Take the highest price in a certain period
ll^^LLV(L,len);//Take the lowest price in a certain period
hl2^^(hh+ll)/2;//Average of highest price and lowest price
avg^^MA(hl2,5);//Calculate the moving average line of the average

ss:SLOPE(avg,len);//Calculate the regression slope of the moving average line


ss<REF(ss,1),SPK;//When the slope becomes smaller, it indicates that the market momentum is weakened, close long positions and open short positions.
ss>REF(ss,1),BPK;//When the slope becomes larger, it indicates that the market momentum is enhanced, close short positions and open long positions.
AUTOFILTER;
Backtest and summary
In this way, we have completed the design of this algorithm, and then we will use the system to backtest the situation for one year.
The subject matter is okex quarterly contract btc;
The backtest period is from January 1, 2019 to present, and the time period is 1 hour;
3 btc for initial account, handling fee of 0.05%;
Set a fixed number of 200 lots per transaction.
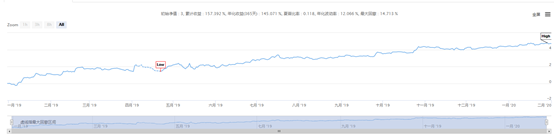
It can be seen from the backtest that this income is relatively smooth and stable.
In this backtest, 1261 transactions were made throughout the year;
Estimated income of 4.68 crypto currency;
Annualized income is about 140%;
The maximum drawdown is 14%;
Sharpe ratio is 0.117.
Source code sharing
Click to go to copy strategy https://www.fmz.com/strategy/183416
The above sharing is some ideas and content of my design, the following is the entire code of M language,
For your reference, study and research. If you need to reprint, please indicate the source. Thank you.
            len:=35;//Design cycles

hh^^HHV(H,len);//Take the highest price in a certain period
ll^^LLV(L,len);//Take the lowest price in a certain period
hl2^^(hh+ll)/2;//Average of highest price and lowest price
avg^^MA(hl2,5);//Calculate the moving average line of the average

ss:SLOPE(avg,len);//Calculate the regression slope of the moving average line


ss<REF(ss,1),SPK;//When the slope becomes smaller, it indicates that the market momentum is weakened, close long positions and open short positions.
ss>REF(ss,1),BPK;//When the slope becomes larger, it indicates that the market momentum is enhanced, close short positions and open long positions.
AUTOFILTER;
- 1