
What is the Aroon indicator?
In the technical analysis, Aroon is a very unique technical indicator. The word "Aroon" comes from Sanskrit, meaning "the light of dawn". It is not as familiar as MA, MACD, and KDJ. It was launched later, and was invented by Tushar Chande in 1995. The author also invented the Chand momentum indicator (CMO). And the intraday momentum index (IMI). If a technical indicator was known by more people and used by more people, then the ability of making profit of this indicator will become less possible, but the relatively new Aroon indicator is exactly the opposite way. From this perspective, the Aroon indicator is actually a good choice.
The Aroon indicator in the chart
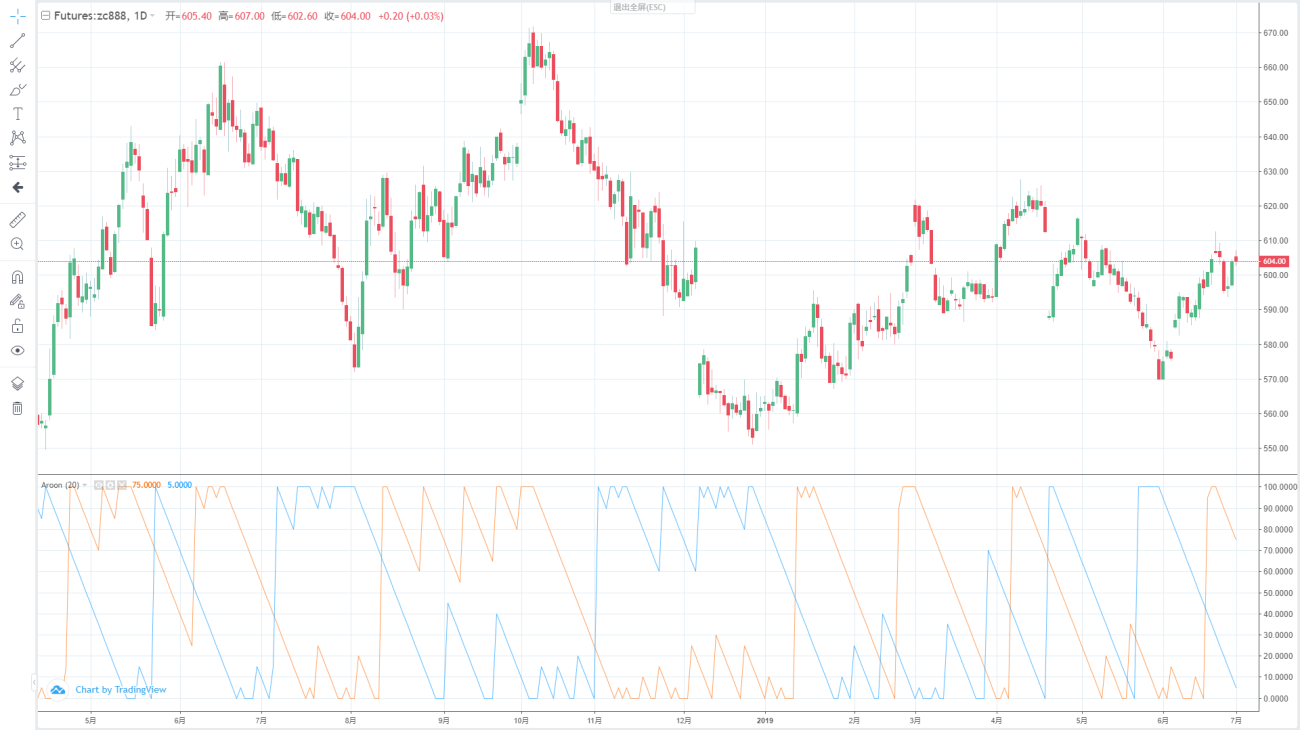
The Aroon indicator helps traders predict the relative positional relationship between price movements and trend areas by calculating the number of K-lines between the highest and lowest prices before the current K-line distance. It consists of two parts: AroonUp and AroonDown. The two lines move up and down between 0 and 100. Although they are named up and down, unlike the BOLL indicator, it's not "the real upper and lower" line. The following picture is the Aroon indicator in the K-line chart:
Calculation method of Aroon indicator
The Aroon indicator requires that you first set a time period parameter, just like setting the average period parameter. In traditional trading software, the number of cycles is 14. In addition, this period parameter is not fixed. You can also set it to 10 or 50 and so on. For the sake of easy understanding, let's define it as: N. After determining N, we can calculate AroonUp and AroonDown.
The specific formula is as follows:
- AroonUp = [ (set period parameter - number of cycles after the highest price) / number of cycles calculated] * 100
- AroonDown = [ (set period parameter - number of cycles after the lowest price) / number of cycles calculated] * 100
From this formula, we can roughly see the idea of the Aroon indicator. That is: how many cycles there are, and the price is below the recent high/low, helping to predict whether the current trend will continue and measuring the strength of the current trend. If we classify this indicator, it is obvious that it belongs to the trend tracking type. But unlike other trend-tracking metrics, it pays more attention to time than price.
How to use the Aroon indicator
AroonUp and AroonDown reflect the current time and the previous highest or lowest price. If the time is near, the value will be larger. If the time is far, the value will be smaller. And when the two lines cross, it indicates that the price direction may change. If AroonUp is above AroonDown, the price is going up, the price may rise; if AroonDown is above AroonUp, the price is in a downward trend, the price May fall.
At the same time, we can also set a few fixed values to accurately find the trading opportunity. We know that the Aroon indicator has been running up and down between 0 and 100. So when the market is on the rise, that is, when AroonUp is above AroonDown, when AroonUp is greater than 50, the market's rising trend has already formed, and the price may continue in the future. when AroonUp under 50, the momentum for price increases is waning, and prices may fluctuate and fall in the future.
On the contrary, when the market is in a downward trend, that is, when AroonDown is above AroonUp, when AroonDown is greater than 50, the market downtrend has already formed, and the price may continue to fall in the future; when AroonDown wears down 50, the driving force for price decline is weakening. Future prices may fluctuate and rise. Then according to the above two paragraphs, we can list the terms of buying and selling as:
- When AroonUp is larger than AroonDown and AroonUp is greater than 50, the long position is opened;
- When AroonUp is smaller than AroonDown, or AroonUp is less than 50, the long position is closed;
- When AroonDown is larger than AroonUp and AroonDown is greater than 50, the short position is opened;
- When AroonDown is smaller than AroonUp, or AroonDown is less than 50, the short position is closed;
Build a trading strategy based on the Aroon indicator
After clarifying the trading logic, we can implement it with code. In this article, we continue to use the JavaScript language, and the trading variety is still commodity futures. reader with strong programming skills can also translate it into Python, or cryptocurrency.
Following by these steps : fmz.com > Login > Dashboard > Strategy Library > New Strategy, start writing the strategy, pay attention to the comments in the code below.
Step 1: Using the CTA Framework
Note that Be sure to click on the following: Commodity Futures Trading Library. If you are adapted it to cryptocurrency, click on: Digital currency spot trading library.
Function main() {
// ZC000/ZC888 refers to using the index as the source of the market but the transaction is mapped to the main contract
$.CTA("ZC000/ZC888", function(st) {
})
}
Step 2: Get the data
            Function main() {
    $.CTA("ZC000/ZC888", function(st) {
        Var r = st.records; // get the K line array
        Var mp = st.position.amount; // Get the number of positions
    })
}
Step 3: Calculate the Aroon indicator
            Function main() {
    $.CTA("ZC000/ZC888", function(st) {
        Var r = st.records; // get the K line array
        Var mp = st.position.amount; // Get the number of positions
        If (r.length < 21) { // Determine if the K line data is sufficient
            Return;
        }
        Var aroon = talib.AROON(r, 20); // Aroon indicator
        Var aroonUp = aroon[1][aroon[1].length - 2]; // Aroon indicator goes online with the second root data
        Var aroonDown = aroon[0][aroon[0].length - 2]; // Aroon's indicator goes down the second root of the data
    })
}
Step 4: Calculate the trading conditions and placing orders
            Function main() {
    $.CTA("ZC000/ZC888", function(st) {
        Var r = st.records; // get the K line array
        Var mp = st.position.amount; // Get the number of positions
        If (r.length < 21) { // Determine if the K line data is sufficient
            Return;
        }
        Var aroon = talib.AROON(r, 20); // Aroon indicator
        Var aroonUp = aroon[1][aroon[1].length - 2]; // Aroon indicator goes online with the second root data
        Var aroonDown = aroon[0][aroon[0].length - 2]; // AAroon's indicator goes down the second root of the data
        If (mp == 0 && aroonUp > aroonDown && aroonUp > 50) {
            Return 1; // long position open
        }
        If (mp == 0 && aroonDown > aroonUp && aroonDown > 50) {
            Return -1; // short position open
        }
        If (mp > 0 && (aroonUp < aroonDown || aroonUp < 50)) {
            Return -1; // multi-head platform
        }
        If (mp < 0 && (aroonDown < aroonUp || aroonDown < 50)) {
            Return 1; // short platform
        }
    })
}
// The above code is a complete strategy based on the JavaScript language.

// --------------------Dividing line--------------------

// In order to take care of the reach of the party, this strategy is also translated into My language. At the same time, this can also be used for digital currency. Here is the complete policy code:
AROONUP := ((N - HHVBARS(H, N)) / N) * 100; // Aroon indicator goes online
AROONDOWN := ((N - LLVBARS(L, N)) / N) * 100; // Aroon indicator goes offline
AROONUP > AROONDOWN && AROONUP > BKV, BK; // Long position open
AROONDOWN > AROONUP && AROONDOWN > SKV, SK; // short position
AROONUP < AROONDOWN || AROONUP < SPV, SP; // Multi-head platform
AROONDOWN < AROONUP || AROONDOWN < BPV, BP; // Short platform
AUTOFILTER;
Strategy backtest
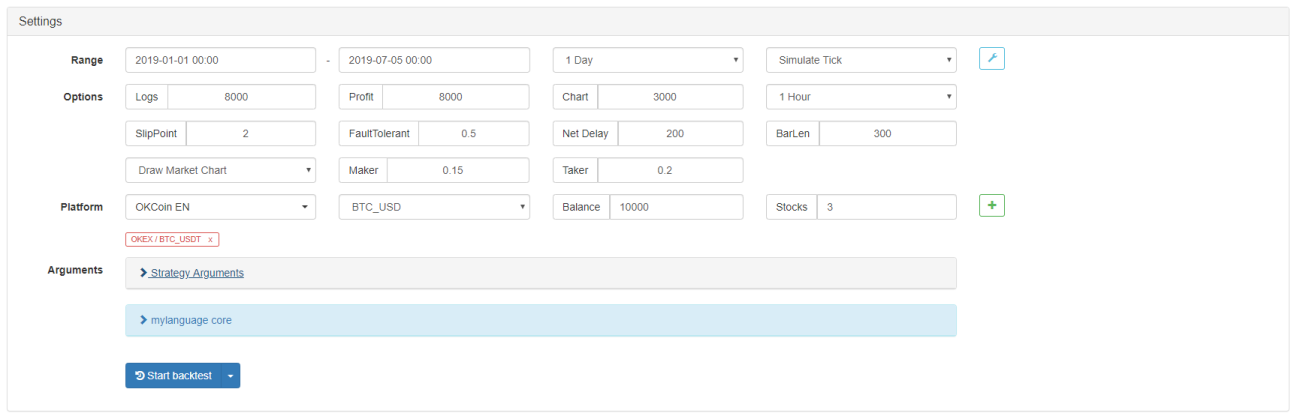
In order to get closer to the real trading environment, we used the 2 pips of slippage and 2 times of the transaction fee to test the pressure during the backtest. The test environment is as follows:
- Quote Variety: Thermal Coal Index
- Trading variety: Thermal Coal Index
- Time: June 01, 2015 ~ June 28, 2019
- Cycle: Daily K line
- Slippage: 2 pips for opening and closing positions
- Transaction Fee: 2 times of the exchange
Test environment
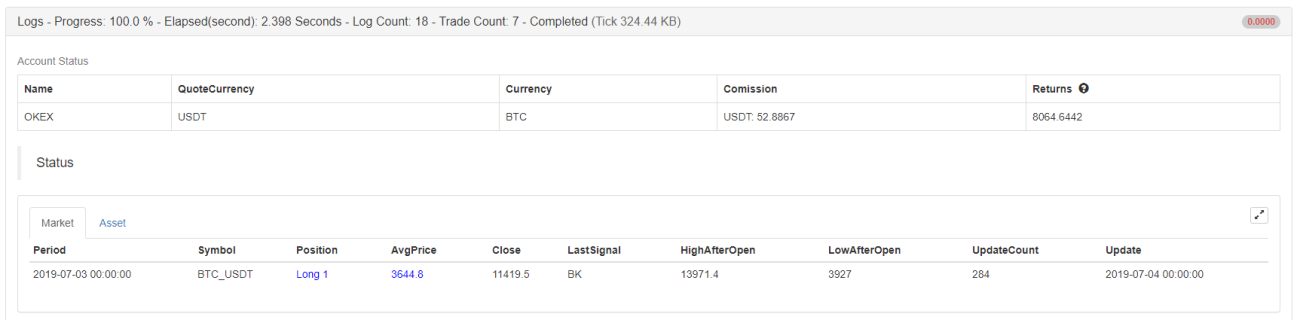
Profit report
Fund curve
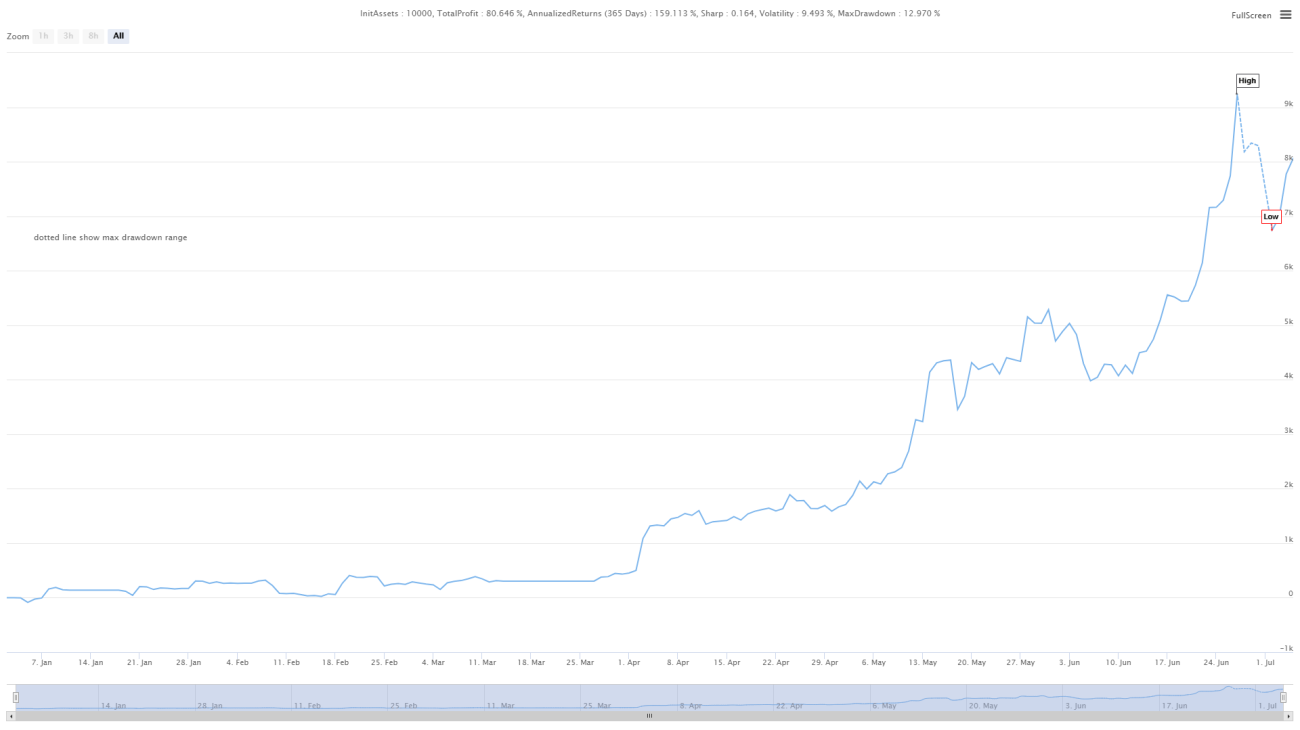
From the above backtest results, the strategy is very good when the market trend is smooth, whether in the rise or fall, the Aroon indicator can completely track the market. The capital curve also showed an overall upward trend, and there was no significant retracement. However, in the volatile market, especially in the continuous shock market, there was a partial retracement.
The advantages and disadvantages of the Aroon indicator
-
Advantages: The Aroon indicator can judge the status of the trend market, take into account the market trend and the ability to judge the price turn, and help traders to increase the use of funds.
-
Disadvantages: The Aroon indicator is only one of the trend tracking indicators, it has the same shortcomings of the trend tracking indicator. it only can judging the number of periods of the highest or lowest price at a given time, but sometimes the highest or lowest price will be contingent in the whole market trend, this contingency will interfere with the Aroon indicator itself, causing false signals.
click on the copy strategy source
For the source code,
with JavaScript version, please click: https://www.fmz.com/strategy/154547
with Mylanguage version, please click: https://www.fmz.com/strategy/155582
Summary
In this strategy, we fixed some parameters, such as: aroonUp or aroonDown is greater than and less than 50, causing the lagging issue of the strategy. In many cases, the market will rise or fall for a period of time before closing the position. Although this improved the winning rate and reduced the maximum retracement rate, it also missed a lot of profits, which also confirmed the truth of the homonym of profit and loss. Interested friends can dig it deeper and improve it.
- 1