
JavaScript strategy backtesting is debugged in DevTools of Chrome browser
For debugging strategies in backtesting systems, usually only the Log() function can be used, so DEBUG is very inefficient and difficult for novice program testers with little experience. For strategy debugging in the JavaScript language, the Chrome browser supports it better, which can implement breakpoint debugging, single-step debugging, variable value monitoring, expression monitoring and so on during backtesting. So let's learn how to use this method to DEBUG the Javascript language strategy backtesting on FMZ platform. Note that this debugging method is supported only for JavaScript language strategies on FMZ platform.
The debugger command on FMZ platform
Inserting the debugger command into the strategy code of the JavaScript language on FMZ allows the program execution to be interrupted during backtesting.
We use the following test strategy code:
javascript
            /*backtest
start: 2022-03-21 09:00:00
end: 2022-06-21 15:00:00
period: 30m
basePeriod: 15m
exchanges: [{"eid":"Binance","currency":"BTC_USDT"}]
*/
function main() {
var n = 1
while (true) {
var t = exchange.GetTicker()
debugger
var r = exchange.GetRecords()
if (n == 1) {
// When placing a purchase order, if there is an error here, an error will be reported, and null will be returned, and GetTicker will return data t with Buy attribute only, and the attribute name is case-sensitive without buy attribute
var id = exchange.Buy(t.buy, 0.1)
var orderBuy = exchange.GetOrder(id)
}
Sleep(500)
}
}
Configure code from backtesting
/*backtest
start: 2022-03-21 09:00:00
end: 2022-06-21 15:00:00
period: 30m
basePeriod: 15m
exchanges: [{"eid":"Binance","currency":"BTC_USDT"}]
*/
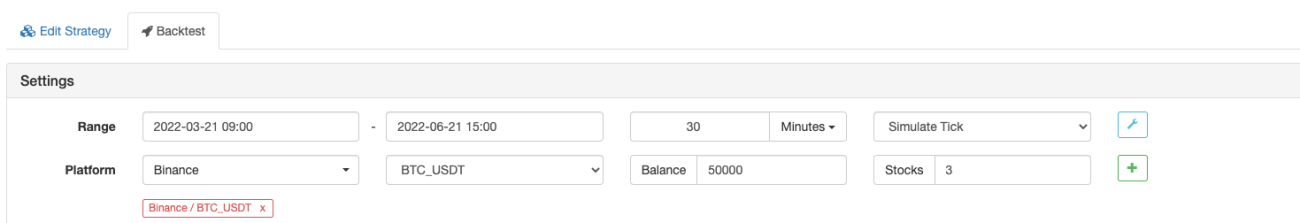
Here we can see that the exchange we added for backtesting is Binance spot, the configuration is as shown in the screenshot:
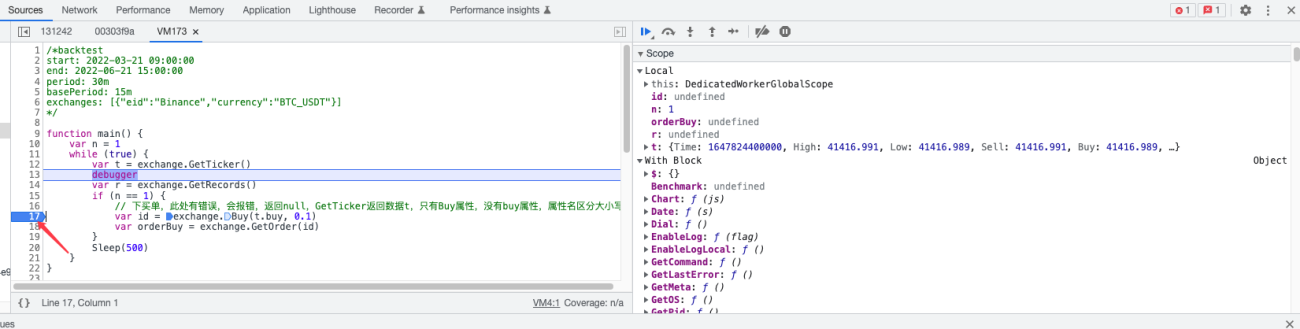
Continuing to look at the strategy code, we can see that we wrote the debugger command under the var t = exchange.GetTicker() sentence, which is equivalent to hitting a breakpoint here, and the program execution will stop at this position. Multiple debuggers can be used in the strategy code, but it is not recommended to do so, just use a breakpoint at a certain location, and subsequent breakpoints can be set in the DevTools debugging function of the browser.
We need to open the DevTools of the Chrome browser before executing the backtest, then the debugger set in the strategy code will take effect. Otherwise, the debugger will be ignored, and the strategy program of backtesting cannot be interrupted or stopped at the breakpoint. After opening DevTools to backtest the strategy, the strategy program will be interrupted at the first setting debugger position, and the debugger can also be set in the global scope of the strategy code.
There are two ways for us to open the DevTools tool of the Chrome browser:
-
- We use the right-click on the page to open the pop-up menu
We click "Check" to display the DevTools interface.
-
- Use the shortcut keys
You can also use the shortcut keys to open
DevToolsby pressingCommand+Option+I (Mac)orControl+Shift+I (Windows, Linux).
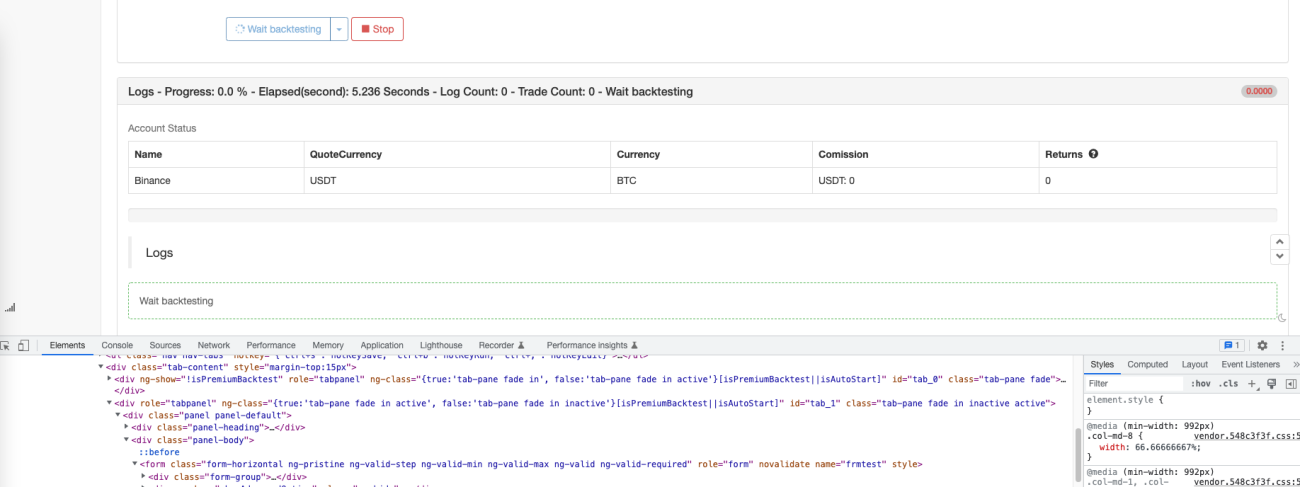
After opening DevTools as shown in the figure:
Interface of DEBUG in the browser for JavaScript language strategy
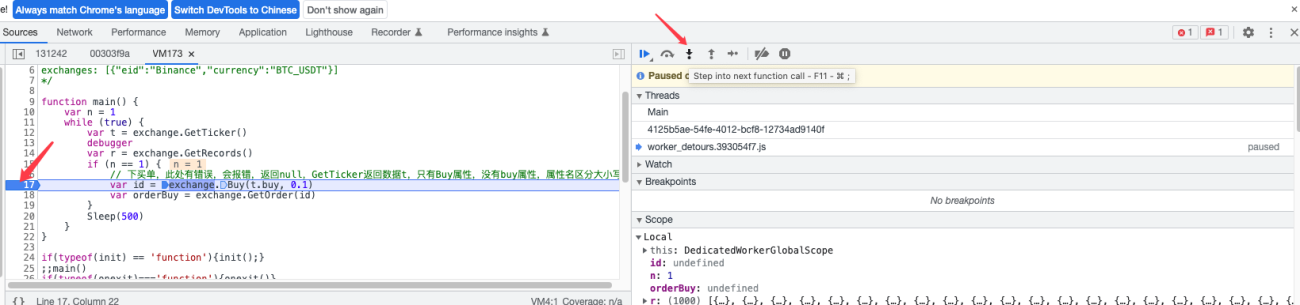
Following the above test, when we click the "Start Backtest" button to backtest the strategy, the strategy breaks and waits at the corresponding position because debugger command is set in the code. The backtest seems to be stuck, as follows:
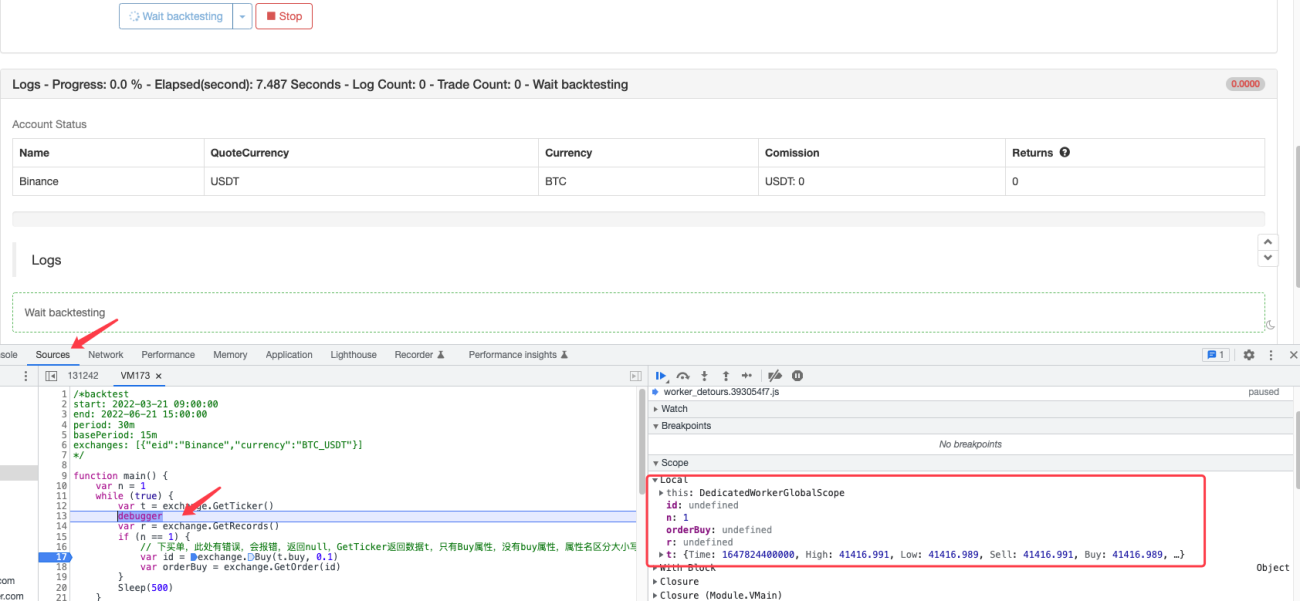
It can be seen that at the position marked interrupted by the strategy debugger, the entire program only executes the market data returned by the function with the value of n being 1, and the value of t being GetTicker. You can see the specific variable values in the red box of the above figure, so that it is easy to observe the value of each variable when the strategy is running.
Set breakpoints for debugging manually
We can click the line number on the left side of the code to add a breakpoint.
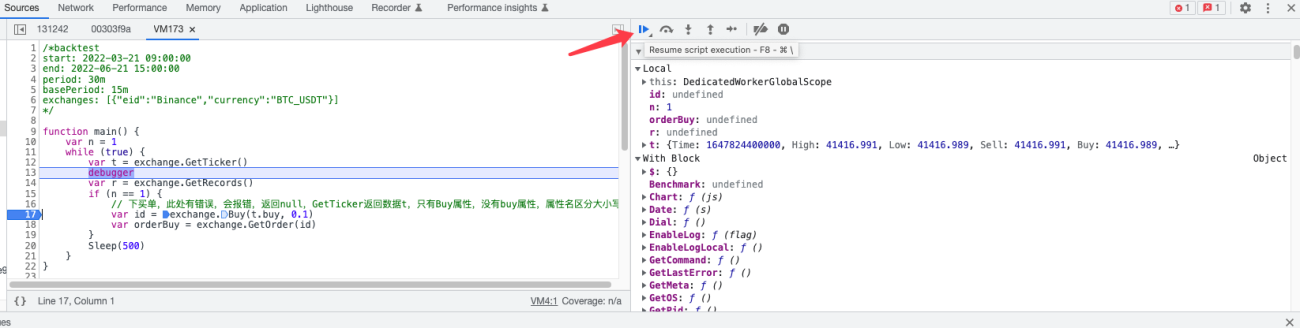
Click "resume script execution" to resume script execution, the program will run to the next breakpoint, if there is no breakpoint or the program has an error that causes an exception, the backtest will end.
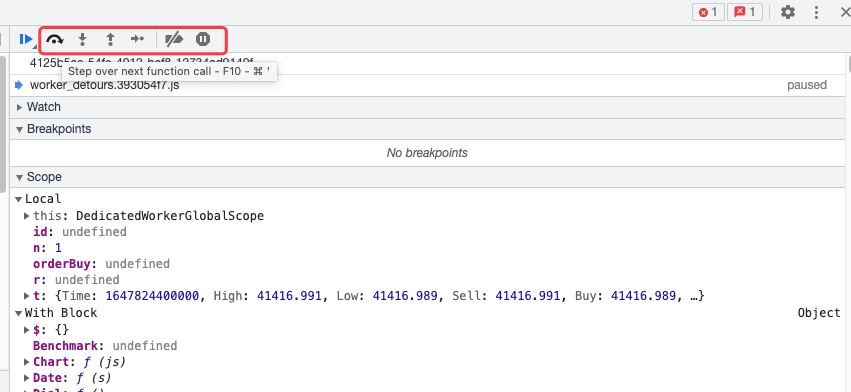
There are also some buttons that can be implemented, for example, skip the next function, go to the next function call, step out of the current function call, execute the single step, ignore all breakpoints, etc.
Test the code DEBUG
At this point, when we continue to click the "resume script execution" button to continue execution, an exception will occur in the strategy program, and the backtest will end with an exception error message printed.
main:17:31 - TypeError: Cannot convert "undefined" to double
Not being case-sensitive for a structure contribute name is a common mistake made by novices.
var id = exchange.Buy(t.buy, 0.1) // When placing a purchase order, if there is an error here, an error will be reported, and null will be returned, and GetTicker will return data t with Buy attribute only, and the attribute name is case-sensitive without buy attribute
The price passed into the exchange.Buy function is an undefined variable, which causes a program exception and ends the backtest.
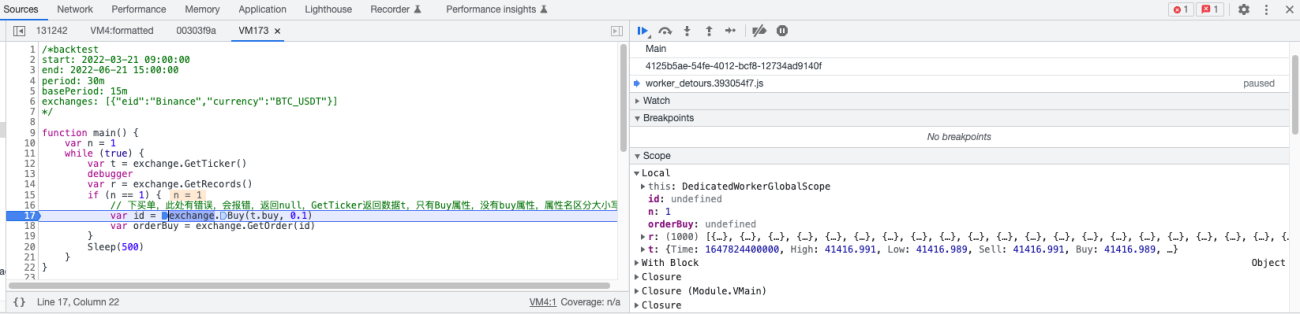
When the program stops at the breakpoint position, this line of code is not executed. We continue to click the "step into next function call" button.
Go to the exchange.Buy function call.
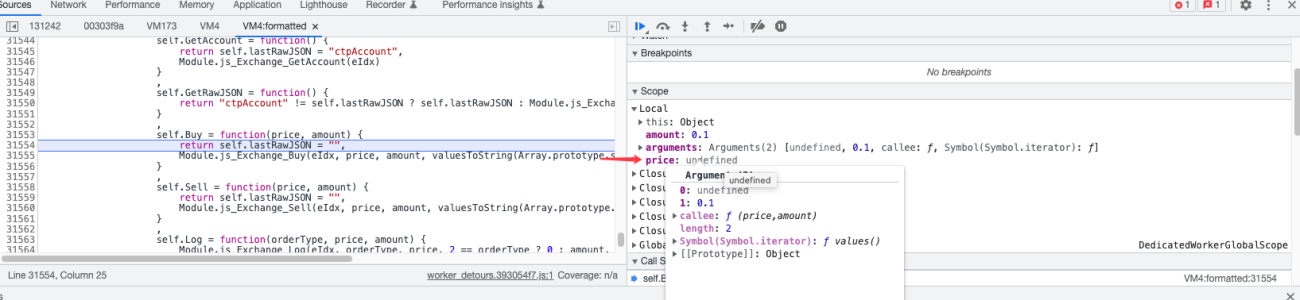
Here we can see that the price is an undefined variable.
By using the above approach, it is easy to find out the program bugs step by step. Many novices often make mistakes, for example, the index of an array is accessed out of bounds, undefined variables are referenced, expressions are written incorrectly, etc, all of them are easy to DEBUG the program.
- 1