
Cryptocurrency Quantitative Trading for Beginners - Taking You Closer to Cryptocurrency Quantitative (2)
In the last article, we talked about programmatic trading scripts. In fact, the trading strategy is a trading script program. The article mainly talks about the need for a hardware carrier for the trading script program (where the program runs), and the script trading program can be written in which kind of computer programming language (three programming languages used on the FMZ Quant Trading Platform are listed. Of course, you can use any programming language to implement strategies for programmatic trading). In this article, we continue to discuss the quantification of the cryptocurrency and learn about it.
Programmatic trading script
-
Types of trading strategy
New beginners to programmed trading and quantitative trading may be confused by terms, such as various trend strategies, arbitrage strategies, high-frequency strategies, grid strategies, etc. In fact, the common types of strategies in programmed trading and quantitative trading are simply several directions.- Arbitrage hedging strategy
Simply put, a strategy that holds a long position while holding a short position can be basically classified as an arbitrage strategy. There are many specific types, such as spot cross-market, futures cross-period, futures and spot arbitrage, and cross-species arbitrage. - Trend strategy
Simply put, it is the strategy of tracking the trend to place orders and hold positions, such as double moving average, MACD and other strategies. - Regression strategy
For example, the grid strategy, making profits from price fluctuations in volatile markets. - High frequency strategy
Simply put, it is a strategy for high frequency trading through some algorithms to discover market microstructures, patterns, opportunities, etc.
The above is divided from the perspective of trading strategies. From the perspective of strategy design on the FMZ Quant Trading Platform, strategies can also be divided into:
- Single-variety strategy
That is to say, this strategy operates only one species, such as BTC trading or ETH trading. - Multi-species strategy
Simply put, it is to operate multiple species according to a strategic logic. - Multi-account strategy
Simply put, multiple exchange objects are configured on a real bot (the concept of an exchange has been introduced in the previous article, and an exchange object with an API KEY configured represents an exchange account). For example, for some follow-the-order strategies, multiple accounts follow the operation together (may be the same exchange or different exchanges). In short, multiple exchange objects (accounts) are managed on a real bot. - Multiple logic strategy
For example, MACD strategy, moving average strategy, grid strategy etc. are designed at the same time in a real bot (of course, it is to operate different exchange objects, and the operation of the same exchange object depends on whether the specific strategy is conflicting logically)
- Arbitrage hedging strategy
-
Exchange API interface
How does the programmatic trading script operate the exchange account? It is through the API interface opened by the exchange.
So what kind of interfaces are open to exchanges? In the previous article, we talked about the exchange have REST and Websocket interfaces generally in the "Exchange" section. Here we add some concepts from the level of strategy procedures. The exchange interfaces are divided by whether they are validated or not (both REST and Websocket), there are verification and non-verification.-
Interfaces that do not require verification
Generally known as "public interface", this type of interface does not require verification ofAPI KEY(if you forget what the API KEY is, you can turn to the previous article). This type of interface is market interface generally, such as querying in-depth market prices, querying K-line data, querying funding rates, querying information about trading varieties, querying exchange server timestamps, etc.
Simply put, the interface that is unrelated to your account can be roughly determined to be a public interface (no verification required)
On the FMZ Quant Trading Platform, when calling an unverified API function (encapsulating the exchange's unverified interface, public interface), even if the API KEY configuration is incorrect, the data returned by the interface can be obtained normally (because of non-verification). -
Interfaces that require verification
Simply put, it is the interface that needs to be verified (via API KEY), this kind of interface is called a private interface. It is usually related to some operations or information of your account, such as querying account assets, querying account positions, querying pending orders, querying transfers, transferring currency, adjusting leverage, setting position mode, etc.
All of these operations must be verified.
On the FMZ Quant Trading Platform, when calling the API function that needs to be verified (the interface that needs to be verified for the encapsulated exchange, private interface), if the API KEY is configured incorrectly, an error will be reported when the interface is called, and a null value will be returned.
So how are these interfaces used on the FMZ Quant Trading Platform?
The FMZ Quant Trading Platform encapsulates the exchange behavior and interfaces with consistent definitions (such as the K-line interface, the in-depth market interface, the current asset query interface, the order interface, the order cancellation interface, etc.), these interfaces are called FMZ Quant Trading Platform API functions on the FMZ Quant Trading Platform, and it can be accessed from the API documentation (https://www.fmz.com/api).
So how are some of the exchange interfaces with different behaviors and definitions used on the FMZ Quant Trading Platform?
These exchange interfaces include: asset transfer, conditional order, batch order placement, batch order cancellation, order modification, etc. Some exchanges have these interfaces, some do not, and their functions and usage details may be quite different, so these interfaces can be accessed through the
exchange.IOfunction on the FMZ Quant Trading Platform (for details, please refer to FMZ Quant Trading Platform API documentation: https://www.fmz.com/api#exchange.io...). There are also some practical IO example strategies on the FMZ Quant Trading Platform strategy square.Do all API functions on the FMZ Quant Trading Platform API document generate network requests?
First and foremost, the API interface of the exchange has access frequency restrictions (such as 5 times per second), and the access cannot be too frequent, otherwise it will report an http 429 error, and the access will be refused (most exchanges report 429). There is the same limitation for calling the encapsulated exchange interface on the Inventor Quantitative Trading Platform, but there is no such limitation on the API functions that do not generate network requests on the FMZ Quant Trading Platform.
Not all API functions of the FMZ Quant Trading Platform will generate network requests. Some of them only modify some local settings, such as setting the current trading pair, setting the contract code, the indicator calculation function and obtaining the exchange object name, etc.
Generally, it can be judged whether a network request occurs from the purpose of the function. As long as the exchange data, the exchange account operations and so on are generated network requests, these interfaces need to pay attention to the calling frequency.-
Let's talk about some common problems and experiences when using API functions on the FMZ Quant Trading Platform
-
Error tolerance
This is the most common error, which has troubled countless beginners. Everything of the strategy backtesting is often normal, why does the real bot run for a while (may be triggered at any time) and then fail?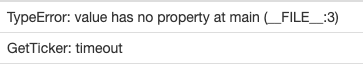
When writing a strategy, we all need to judge and verify the data returned by the interface. For example, the line of market price code to obtain on the FMZ Quant Trading Platform (the same as writing a program to access the exchange interface directly by yourself):
var ticker = exchange. GetTicker(), if we need to use theLast(last price) data in thetickervariable (refer to the structure returned by the GetTicker function), we need to usevar newPrice = ticker.Lastto obtain data like this (what is newPrice? new: latest, Price: price, yes! All together!) At this point, if theGetTicker()function returns to normal data, it's OK, but if there is a request timeout, network error, the exchange pulls the network cable, the cable is cut, the kid pulls the electric switch, etc.. It will cause theGetTicker()function to return tonull. At this time, the value oftickerisnull, and if I go to access itsLast, a program exception will occur and the strategy program will stop.
It seems that the failure of the interface call (the GetTicker call fails and returns null) is not the direct reason of the stop of strategy's real bot (the direct reason is that an attribute of anullvariable is accessed). The error report of interface call failure will not cause the real bot stop (emphasis).
So what can we do to avoid the abnormal stop of the real bot?
The answer is to perform fault-tolerant processing on the data returned by the interface. It is very simple, just judge whether the returned data isnull(an example of JavaScript language, other languages are usually the same)
Write a short code segment for description (this is just a description, you can't run it directly!)var ticker = exchange.GetTicker() if (ticker) { var newPrice = ticker.Last Log("Print the latest price:", newPrice) } else { // The data is null, there will be no problem if no operation is performed }Not only the
GetTickerinterface needs to be fault-tolerant, but the interface with network requests needs to be fault-tolerant for the return value (if you use the return value of the function)
There are many fault-tolerant methods, you can use the_C()function (refer to the FMZ API documentation) to write fault-tolerant function and design fault-tolerant mechanism and logic by yourself.
As for the use of the_C()function, many beginners usaully use it incorrectly. Note that the parameter of the_C()function is a function reference, not a function call. In layman's terms:
_C(funcName, param1, param2), the call is correct, funcName is without parentheses, and param1 and param2 are the parameters to be passed to the function funcName.
_C(funcName(param1, param2)), the call is incorrect, usually written by beginners who does not read the FMZ API documentation seriously. -
The order quantity of the spot market order buy order
The order quantity of the spot market order buy order is also easy to make mistakes by beginners, as mentioned in the previous article, the order quantity of the spot market order buy order is usually the amount (very few exchanges may be other settings, generally, these special exchange settings on FMZ will be explained in the FMZ API document), for example, I use OKEX V5 demo to test:
The trading pair is set as:LTC_USDTfunction main() { exchange.IO("simulate", true) // Switch to the demo of OKEX exchange exchange.Buy(-1, 1) // The price is -1, indicating that the order placed is a market order, and the quantity is 1, indicating that the order amount is 1USDT }Since exchanges generally have a limit on the order amount, orders smaller than the limit will not be placed (for example, Binance Spot requires each order greater than 5USDT before it can be placed successfully).Therefore, it will report an error if you place an order like this:
Error Buy(-1, 1): map[code:1 data:[map[clOrdId: ordId: sCode:51020 sMsg:Order amount should be greater than the min available amount. tag:]] msg:] -
Direction in placing future orders
When making futures strategies, the direction of placing orders is often made mistakes by beginners, which leads to problems. Take writing strategies on the FMZ Quant Trading Platform as an example.
Let's look at the description on the API documentation first:
https://www.fmz.com/api#exchange.setdirection...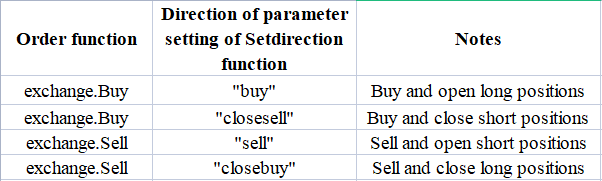
As the order function is only
Buy,Sell. However, futures (of course, there is no problem with the spot, the spot is only bought and sold) have the directions of opening long, closing long, opening short and closing short, so it's obvious that Buy/Sell cannot express operations in so many directions. At this time, it is necessary to introduce the functionexchange.SetDirection(), which sets futures trading direction.
On FMZ,
exchange.SetDirection("buy")(set the direction first) is used in conjunction withexchange.Buy, it means that the order placed is an order to open a long position.
And so forth:
exchange.SetDirection("sell")is used in conjunction withexchange.Sell, it means that the order placed is an order to open a short position.
exchange.SetDirection("closebuy")is used in conjunction withexchange.Sell, it means that the order placed is an order to close a long position.
exchange.SetDirection("closesell")is used in conjunction withexchange.Buy, it means that the order placed is an order to close a short position.
Beginners usually useexchange.SetDirection("sell")in conjunction withexchange.Buy, or other wrong combinations. Then an error is reported (backtesting may not report an error, but this is obviously a logical error, obsessive-compulsive disorder cannot tolerate...).
Another common mistake made by beginnersfunction main() { exchange.SetContractType("quarter") // Set the current contract as a quarterly contract exchange.SetDirection("sell") var id = exchange.Sell(-1, 1) Log("See my market order is placed and the transaction is completed, there is a position", exchange.GetPosition()) exchange.SetDirection("closebuy") // closebuy is used in conjunction with Sell, yes~ exchange.Sell(-1, 1) }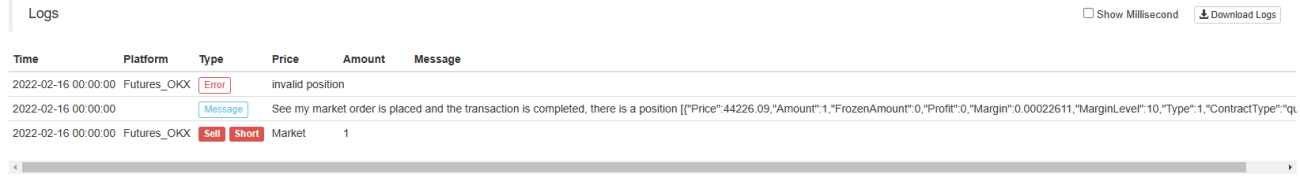
Here you may ask: "Why do I have a position and closebuy and Sell are also used together, why do I get an error and can't close the position?" I would answer: "You have closed the wrong direction! The long position should be closed".
One of the possible situations in the above error report is: the closing direction is set correctly, the order function is used correctly, and the position in this direction is also held, but the error is still reported.
The reason is that your program may have placed multiple orders, but the initial order has not been filled, and the closing order is pending on the market. At this time, the program continues to close the position, and an error of exceeding the closing position will be prompted. -
Log output, transaction information display
The design of programmed and quantitative trading strategies is inseparable from the design of human-computer interaction, such as "data display" and "operation log output". We usually use the native programming language to write real bot scripts and strategy programs. The output functions of the current language are used directly.
For example:
python useprint.
javascript useconsole.log.
Golang usefmt.Println().
C++ usecoutLet's talk about the information display on the FMZ platform, on the FMZ Quant Trading Platform, there are two main places where the information is displayed.
-
Status column
After the real bot is running, the real bot page is as shown in the figure:
The display part is the status column information. The status column is mainly used to display some real-time changing data (because real-time changes need to be observed in real time, and it cannot be printed as a log every time, this type of data can be displayed in the status column. The log will repeat a lot of duplicate and meaningless data, affecting the query if each log is printed).
The data displayed on the status column uses theLogStatusfunction. For details, please refer to the FMZ API documentation. -
Log column
Also dispalyed on the real bot page, as shown in the figure:
The display part is the log column. The log column is mainly used to record certain data at a certain time permanently, or record an operation of a certain strategy at a certain time.
There are various types of logs:-
Common log, strategies on FMZ adopt the Log function to output and print it in the strategy log.

-
Order log, use
exchange.Sell/exchange.Buyin FMZ's strategy will record in the log output automatically.
-
Cancellation log,
exchange.CancelOrderis used in FMZ's strategy, which will output the cancellation log in the log automatically.
-
Error log, when the strategy on FMZ is running, a call error occurs on the interface that makes a network request, an exception is thrown (such as a statement of throw), the error log is output in the log automatically.

-
API functions on FMZ, functions that can generate log output such as Log(...), exchange.Buy(Price, Amount), exchange.CancelOrder(Id), etc., all of them can be followed by some additional output parameters after the necessary parameters, such as: exchange. CancelOrder(orders[j].Id, orders[j]), this is to output the order information when the order of orders[j] is cancelled.
function main() { Log("data1", "data2", "data3", "...") var data2 = 200 var id = exchange.Sell(100000, 0.1, "Attached data1", data2, "...") exchange.CancelOrder(id, "Attached data1", data2, "...") LogProfit(100, "Attached data1", data2, "...") } -
-
Use of indicator functions
Before talking about the indicator function, let's understand what an indicator is first. Simply put, it is a line, such as moving average, MACD and ATR.
Q: Where did these indicators come from?
A: Of course it is calculated.
Q: What is the basis of the calculation?
A: Calculation based on K-line data.
Q: Take an example?
A: Taking the simplest indicator moving average indicator as an example, if we use the daily K-line (that is, a positive or negative line represents a day) data as the data source for the indicator calculation. The moving average indicator parameter is 10, then the calculated moving average indicator is the 10-day moving average.
Q: Can the moving average indicator be calculated if the number of K-line BARs is less than 10?
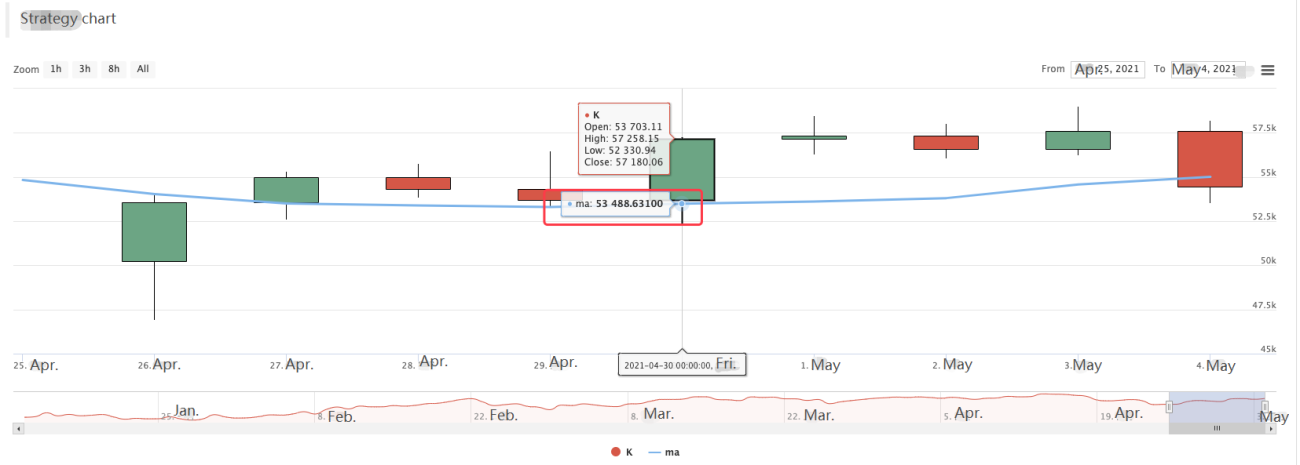
A: Not only the moving average indicator cannot be calculated, but any indicator cannot calculate the effective index value when the number of K-line data BAR does not meet the indicator period parameter, and the corresponding position of the calculated array will be filled with empty values, for example, theJavaScriptlanguage strategy will displaynullwhen printing the calculated indicator data.It happens that there is a tutrial example in the strategy square: https://www.fmz.com/strategy/125770
Backtest the tutrial example strategy, we can see the chart generated by the backtesting system and the 10-period moving average:
Strategy custom drawing, drawn K-line as well as moving average charts.
Q: What if I want a 10-hour moving average?
A: Using K-line data with the hourly period K-line data will be fine.In layman's terms, the K-line we see is an array after we digitize it (you can ask Baidu if you don't understand the concept of array), each element of which is a K-line column, which is arranged in order, the first element in the array is the farthest from the current time, and the last element of the array is the closest to the current time.
Usually, the last bar of the K-line data is the bar of the current period, which changes in real time and it is uncompleted (you can observe the changes by logging into an exchange page and observe the K-line). The calculated indicators are also in correspondence with the K-line bars. In the above example, we can see that an indicator value corresponds to a K-line bar. Note that the last K-line bar changes in real time, and the calculated indicator will also change with the change of the K-line bar.On the FMZ Quant Trading Platform, we can use the TA library (the library implemented by the FMZ platform, integrated in the docker, and various languages can be used directly) or the talib library (the old talib indicator library, JS, C++ integration, Python needs to be installed by yourself).
For example, to calculate the moving average in the above example:
Use the TA library:function main() { var records = exchange.GetRecords() var ma = TA.MA(records, 10) Log(ma) // print moving average }Use the talib library:
            function main() {
    var records = exchange.GetRecords()
    var ma = talib.MA(records, 10)
    Log(ma)       // print moving average
}
The calculated indicator data ma is an array, and each element corresponds to the K-line array (records) one-to-one, that is,
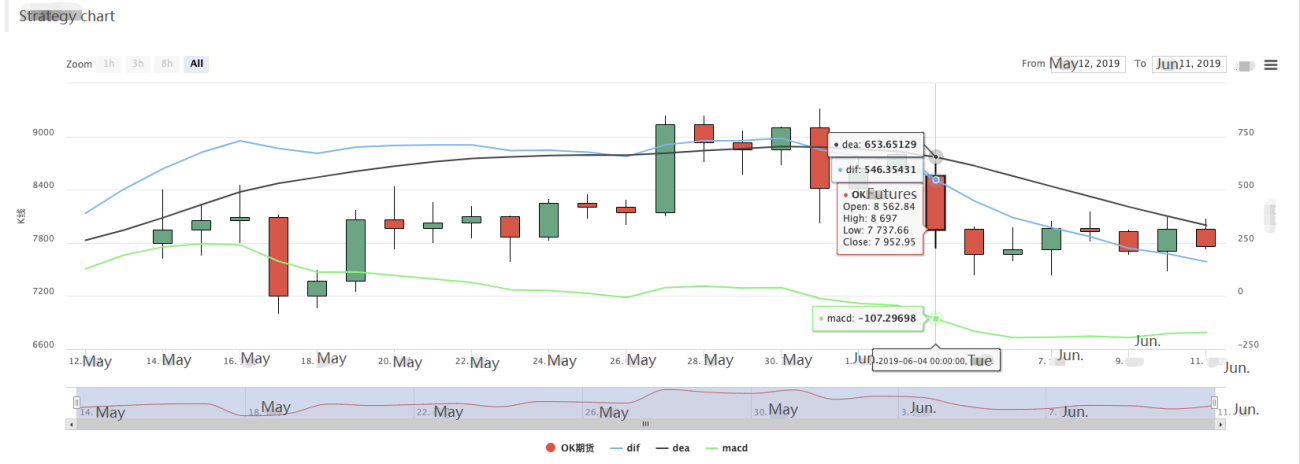
ma[ma.length -1]corresponds torecords[records.length - 1], and so on.The same goes for other complex indicators, and we need to pay attention to indicators such as MACD.
var macd = TA.MACD(records) // In this way, only the K-line data is passed in, not the indicator parameters. The indicator parameters use the default values, and the same goes for other indicator functions.At this time, the variable macd is a two-dimensional array (you can ask Baidu if you don't understand the concept). A two-dimensional array is simply an array, and each element of it is also an array.
Q: Why is the macd indicator data a two-dimensional array?
A: Because the macd indicator is composed of two lines (dif line, dea line) and a set of volume bars (macd volume bar, in fact, this volume bar data can also be regarded as a line). So the macd variable can be split into:var dif = macd[0] var dea = macd[1] var macdColumn = macd[2]Here is also a ready-made tutrial example, if interested, you can study at: https://www.fmz.com/strategy/151972
-
-
- 1