
来自YouTube大神的「神奇的双EMA均线策略」
本期我们来探讨一个来源于YouTube的「神奇的双EMA均线策略」,这个策略被称为“股票和加密货币市场杀手”。小编我观看视频了解到这个策略是一个trading view的pine语言策略,用到了2个trading view指标。看到视频中的回测效果非常好,FMZ也支持Trading View的Pine语言,所以就忍不住想要自己回测、测试分析。那么就开始整活!这就动手把视频中的策略复刻下来。
策略使用的指标
1、EMA指标
为了简便设计,我们就不使用视频上列举的Moving Average Exponential。我们使用trading view的内置ta.ema代替(其实都一样)。
2、VuManChu Swing Free指标
这个是一个Trading View上的指标,我们需要去Trading View上把源码扒下来。
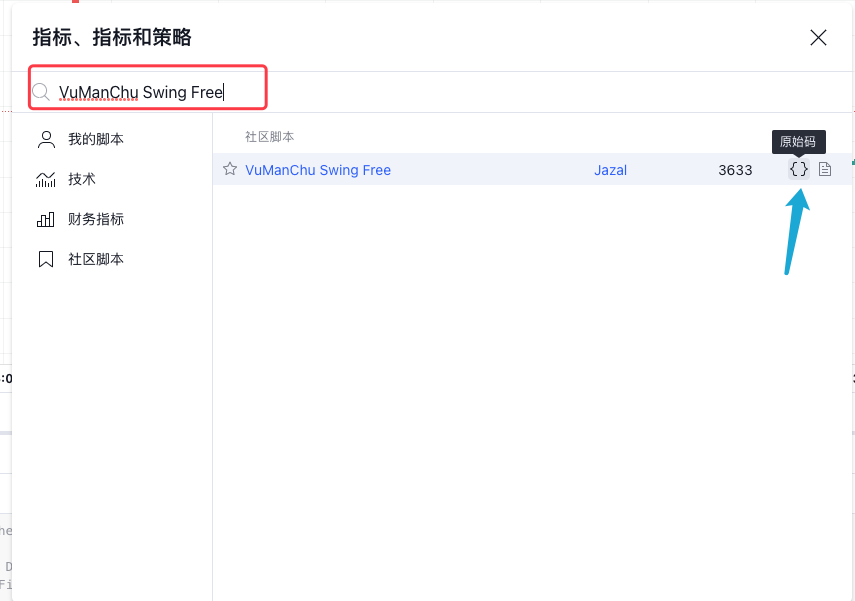
VuManChu Swing Free代码:
pine
// This source code is subject to the terms of the Mozilla Public License 2.0 at https://mozilla.org/MPL/2.0/
// Credits to the original Script - Range Filter DonovanWall https://www.tradingview.com/script/lut7sBgG-Range-Filter-DW/
// This version is the old version of the Range Filter with less settings to tinker with
//@version=4
study(title="Range Filter - B&S Signals", shorttitle="RF - B&S Signals", overlay=true)
//-----------------------------------------------------------------------------------------------------------------------------------------------------------------
//Functions
//-----------------------------------------------------------------------------------------------------------------------------------------------------------------
//Range Size Function
rng_size(x, qty, n)=>
// AC = Cond_EMA(abs(x - x[1]), 1, n)
wper = (n*2) - 1
avrng = ema(abs(x - x[1]), n)
AC = ema(avrng, wper)*qty
rng_size = AC
//Range Filter Function
rng_filt(x, rng_, n)=>
r = rng_
var rfilt = array.new_float(2, x)
array.set(rfilt, 1, array.get(rfilt, 0))
if x - r > array.get(rfilt, 1)
array.set(rfilt, 0, x - r)
if x + r < array.get(rfilt, 1)
array.set(rfilt, 0, x + r)
rng_filt1 = array.get(rfilt, 0)
hi_band = rng_filt1 + r
lo_band = rng_filt1 - r
rng_filt = rng_filt1
[hi_band, lo_band, rng_filt]
//-----------------------------------------------------------------------------------------------------------------------------------------------------------------
//Inputs
//-----------------------------------------------------------------------------------------------------------------------------------------------------------------
//Range Source
rng_src = input(defval=close, type=input.source, title="Swing Source")
//Range Period
rng_per = input(defval=20, minval=1, title="Swing Period")
//Range Size Inputs
rng_qty = input(defval=3.5, minval=0.0000001, title="Swing Multiplier")
//Bar Colors
use_barcolor = input(defval=false, type=input.bool, title="Bar Colors On/Off")
//-----------------------------------------------------------------------------------------------------------------------------------------------------------------
//Definitions
//-----------------------------------------------------------------------------------------------------------------------------------------------------------------
//Range Filter Values
[h_band, l_band, filt] = rng_filt(rng_src, rng_size(rng_src, rng_qty, rng_per), rng_per)
//Direction Conditions
var fdir = 0.0
fdir := filt > filt[1] ? 1 : filt < filt[1] ? -1 : fdir
upward = fdir==1 ? 1 : 0
downward = fdir==-1 ? 1 : 0
//Trading Condition
longCond = rng_src > filt and rng_src > rng_src[1] and upward > 0 or rng_src > filt and rng_src < rng_src[1] and upward > 0
shortCond = rng_src < filt and rng_src < rng_src[1] and downward > 0 or rng_src < filt and rng_src > rng_src[1] and downward > 0
CondIni = 0
CondIni := longCond ? 1 : shortCond ? -1 : CondIni[1]
longCondition = longCond and CondIni[1] == -1
shortCondition = shortCond and CondIni[1] == 1
//Colors
filt_color = upward ? #05ff9b : downward ? #ff0583 : #cccccc
bar_color = upward and (rng_src > filt) ? (rng_src > rng_src[1] ? #05ff9b : #00b36b) :
downward and (rng_src < filt) ? (rng_src < rng_src[1] ? #ff0583 : #b8005d) : #cccccc
//-----------------------------------------------------------------------------------------------------------------------------------------------------------------
//Outputs
//-----------------------------------------------------------------------------------------------------------------------------------------------------------------
//Filter Plot
filt_plot = plot(filt, color=filt_color, transp=67, linewidth=3, title="Filter")
//Band Plots
h_band_plot = plot(h_band, color=color.new(#05ff9b, 100), title="High Band")
l_band_plot = plot(l_band, color=color.new(#ff0583, 100), title="Low Band")
//Band Fills
fill(h_band_plot, filt_plot, color=color.new(#00b36b, 92), title="High Band Fill")
fill(l_band_plot, filt_plot, color=color.new(#b8005d, 92), title="Low Band Fill")
//Bar Color
barcolor(use_barcolor ? bar_color : na)
//Plot Buy and Sell Labels
plotshape(longCondition, title = "Buy Signal", text ="BUY", textcolor = color.white, style=shape.labelup, size = size.normal, location=location.belowbar, color = color.new(color.green, 0))
plotshape(shortCondition, title = "Sell Signal", text ="SELL", textcolor = color.white, style=shape.labeldown, size = size.normal, location=location.abovebar, color = color.new(color.red, 0))
//Alerts
alertcondition(longCondition, title="Buy Alert", message = "BUY")
alertcondition(shortCondition, title="Sell Alert", message = "SELL")
策略逻辑
EMA指标:策略使用两根EMA均线,一根快线(小周期参数),一根慢线(大周期参数)。双EMA均线的作用主要是帮助我们判断市场趋势方向。
-
多头排列
快线在慢线上方。 -
空头排列
快线在慢线下方。
VuManChu Swing Free指标:VuManChu Swing Free指标用来发出信号,再结合其它条件判断是否进行下单交易。从VuManChu Swing Free指标源码可以看出:longCondition变量就代表买入信号,shortCondition变量就代表卖出信号。后续编写下单条件就使用这两个变量。
现在我们来讲下策略具体的交易信号触发条件:
1、进入多头的规则:
阳K线的收盘价要处在EMA快线的上方,两根EMA均线要呈现多头排列(快线在慢线上方),VuManChu Swing Free指标要出现买入信号(longCondition为真)。三个条件成立,这根K线就是做多入场的关键K线,这根K线的收盘价就是入场位置。
2、进入空头的规则(和多头相反):
阴K线的收盘价要处在EMA快线的下方,两根EMA均线要呈现空头排列(快线在慢线下方),VuManChu Swing Free指标要出现卖出信号(shortCondition为真)。三个条件成立,这根K线的收盘价就是做空入场位置。
交易逻辑是不是很简单,由于出处的视频中没有具体说明止盈止损,小编这里就自由发挥一下使用一种比较中庸的止盈止损方式,使用固定点数止损,跟踪止盈。
代码设计
VuManChu Swing Free指标的代码,我们直接原封不动地放进我们的策略代码中。
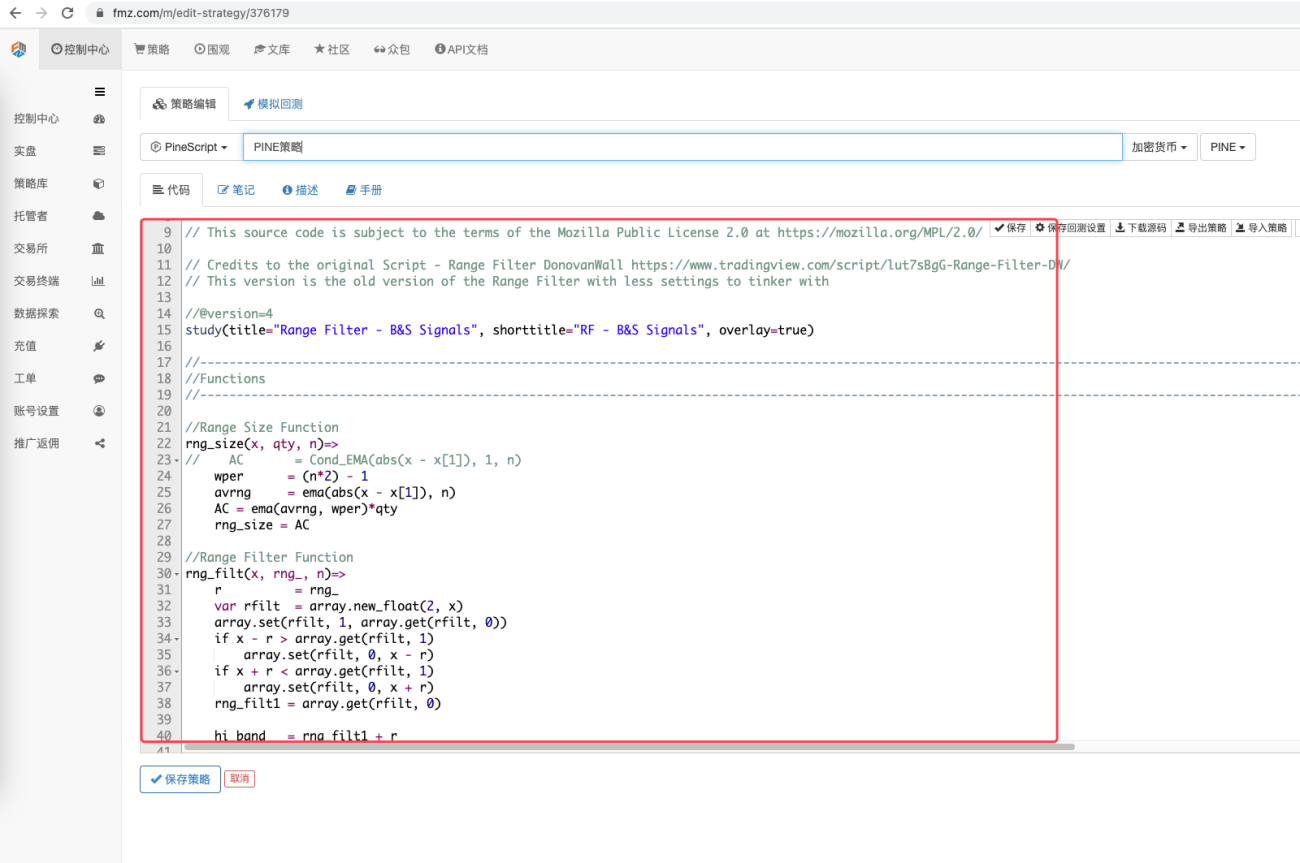
然后紧跟着我们编写一段Pine语言代码,实现交易功能:
pine
// extend
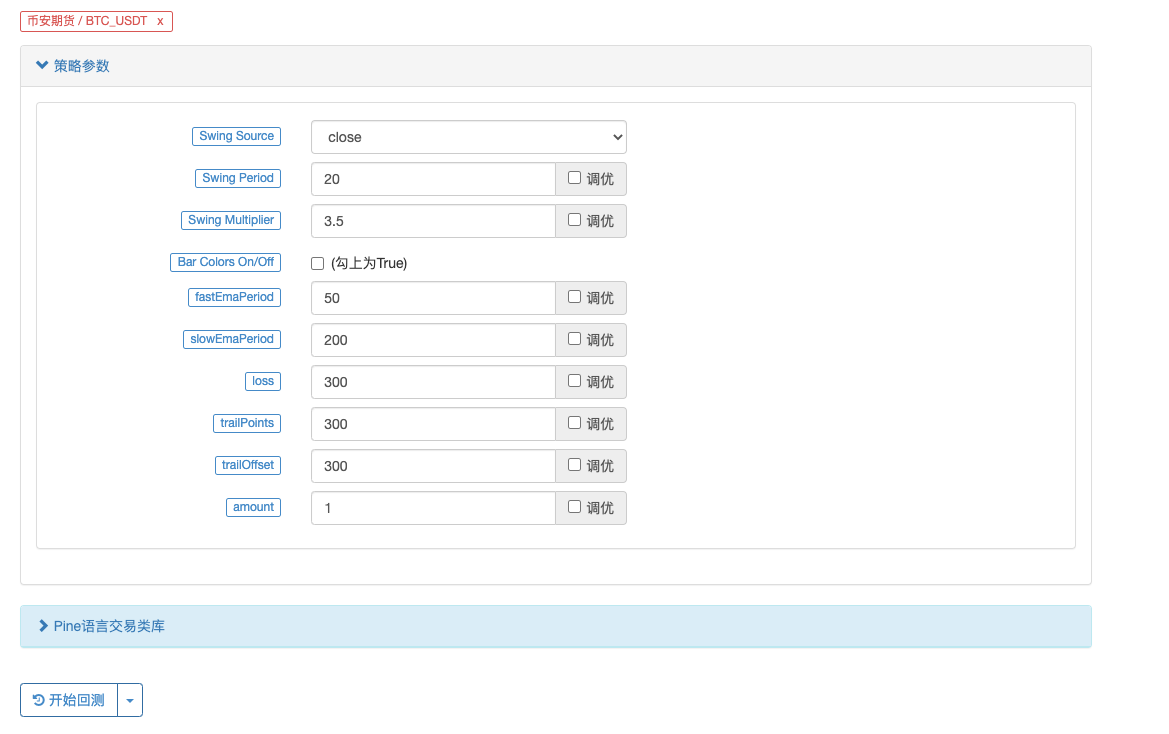
fastEmaPeriod = input(50, "fastEmaPeriod") // 快线周期
slowEmaPeriod = input(200, "slowEmaPeriod") // 慢线周期
loss = input(30, "loss") // 止损点数
trailPoints = input(30, "trailPoints") // 移动止盈触发点数
trailOffset = input(30, "trailOffset") // 移动止盈偏移量(点数)
amount = input(1, "amount") // 下单量
emaFast = ta.ema(close, fastEmaPeriod) // 计算快线EMA
emaSlow = ta.ema(close, slowEmaPeriod) // 计算慢线EMA
buyCondition = longCondition and emaFast > emaSlow and close > open and close > emaFast // 做多入场条件
sellCondition = shortCondition and emaFast < emaSlow and close < open and close < emaFast // 做空入场条件
if buyCondition and strategy.position_size == 0
strategy.entry("long", strategy.long, amount)
strategy.exit("exit_long", "long", amount, loss=loss, trail_points=trailPoints, trail_offset=trailOffset)
if sellCondition and strategy.position_size == 0
strategy.entry("short", strategy.short, amount)
strategy.exit("exit_short", "short", amount, loss=loss, trail_points=trailPoints, trail_offset=trailOffset)
A.可以看到,当buyCondition为真时即:
1、longCondition变量为真(VuManChu Swing Free指标发出信号做多)。
2、emaFast > emaSlow (EMA多头排列)。
3、close > open (表示当前BAR为阳线),close > emaFast (表示收盘价在EMA快线上方)。
做多的三个条件成立。
B.当sellCondition为真时,则做空的三个条件成立(这里不再赘述)。
然后就在if条件判断信号触发的情况下,使用strategy.entry函数入场开仓,同时设置strategy.exit函数止损、跟踪止盈。
完整的代码
            pine

            /*backtest
start: 2022-01-01 00:00:00
end: 2022-10-08 00:00:00
period: 15m
basePeriod: 5m
exchanges: [{"eid":"Futures_Binance","currency":"ETH_USDT"}]
args: [["ZPrecision",0,358374]]
*/

// This source code is subject to the terms of the Mozilla Public License 2.0 at https://mozilla.org/MPL/2.0/

// Credits to the original Script - Range Filter DonovanWall https://www.tradingview.com/script/lut7sBgG-Range-Filter-DW/
// This version is the old version of the Range Filter with less settings to tinker with

//@version=4
study(title="Range Filter - B&S Signals", shorttitle="RF - B&S Signals", overlay=true)

//-----------------------------------------------------------------------------------------------------------------------------------------------------------------
//Functions
//-----------------------------------------------------------------------------------------------------------------------------------------------------------------

//Range Size Function
rng_size(x, qty, n)=>
//    AC       = Cond_EMA(abs(x - x[1]), 1, n)
    wper      = (n*2) - 1
    avrng     = ema(abs(x - x[1]), n)
    AC = ema(avrng, wper)*qty
    rng_size = AC

//Range Filter Function
rng_filt(x, rng_, n)=>
    r          = rng_
    var rfilt  = array.new_float(2, x)
    array.set(rfilt, 1, array.get(rfilt, 0))
    if x - r > array.get(rfilt, 1)
        array.set(rfilt, 0, x - r)
    if x + r < array.get(rfilt, 1)
        array.set(rfilt, 0, x + r)
    rng_filt1 = array.get(rfilt, 0)

    hi_band   = rng_filt1 + r
    lo_band   = rng_filt1 - r
    rng_filt  = rng_filt1
    [hi_band, lo_band, rng_filt]

//-----------------------------------------------------------------------------------------------------------------------------------------------------------------
//Inputs
//-----------------------------------------------------------------------------------------------------------------------------------------------------------------

//Range Source
rng_src = input(defval=close, type=input.source, title="Swing Source")

//Range Period
rng_per = input(defval=20, minval=1, title="Swing Period")

//Range Size Inputs
rng_qty   = input(defval=3.5, minval=0.0000001, title="Swing Multiplier")

//Bar Colors
use_barcolor = input(defval=false, type=input.bool, title="Bar Colors On/Off")

//-----------------------------------------------------------------------------------------------------------------------------------------------------------------
//Definitions
//-----------------------------------------------------------------------------------------------------------------------------------------------------------------

//Range Filter Values
[h_band, l_band, filt] = rng_filt(rng_src, rng_size(rng_src, rng_qty, rng_per), rng_per)

//Direction Conditions
var fdir = 0.0
fdir    := filt > filt[1] ? 1 : filt < filt[1] ? -1 : fdir
upward   = fdir==1 ? 1 : 0
downward = fdir==-1 ? 1 : 0

//Trading Condition
longCond = rng_src > filt and rng_src > rng_src[1] and upward > 0 or rng_src > filt and rng_src < rng_src[1] and upward > 0
shortCond = rng_src < filt and rng_src < rng_src[1] and downward > 0 or rng_src < filt and rng_src > rng_src[1] and downward > 0

CondIni = 0
CondIni := longCond ? 1 : shortCond ? -1 : CondIni[1]
longCondition = longCond and CondIni[1] == -1
shortCondition = shortCond and CondIni[1] == 1

//Colors
filt_color = upward ? #05ff9b : downward ? #ff0583 : #cccccc
bar_color  = upward and (rng_src > filt) ? (rng_src > rng_src[1] ? #05ff9b : #00b36b) :
             downward and (rng_src < filt) ? (rng_src < rng_src[1] ? #ff0583 : #b8005d) : #cccccc

//-----------------------------------------------------------------------------------------------------------------------------------------------------------------
//Outputs
//-----------------------------------------------------------------------------------------------------------------------------------------------------------------

//Filter Plot
filt_plot = plot(filt, color=filt_color, transp=67, linewidth=3, title="Filter")

//Band Plots
h_band_plot = plot(h_band, color=color.new(#05ff9b, 100), title="High Band")
l_band_plot = plot(l_band, color=color.new(#ff0583, 100), title="Low Band")

//Band Fills
fill(h_band_plot, filt_plot, color=color.new(#00b36b, 92), title="High Band Fill")
fill(l_band_plot, filt_plot, color=color.new(#b8005d, 92), title="Low Band Fill")

//Bar Color
barcolor(use_barcolor ? bar_color : na)

//Plot Buy and Sell Labels
plotshape(longCondition, title = "Buy Signal", text ="BUY", textcolor = color.white, style=shape.labelup, size = size.normal, location=location.belowbar, color = color.new(color.green, 0))
plotshape(shortCondition, title = "Sell Signal", text ="SELL", textcolor = color.white, style=shape.labeldown, size = size.normal, location=location.abovebar, color = color.new(color.red, 0))

//Alerts
alertcondition(longCondition, title="Buy Alert", message = "BUY")
alertcondition(shortCondition, title="Sell Alert", message = "SELL")


// extend
fastEmaPeriod = input(50, "fastEmaPeriod")
slowEmaPeriod = input(200, "slowEmaPeriod")
loss = input(30, "loss")
trailPoints = input(30, "trailPoints")
trailOffset = input(30, "trailOffset")
amount = input(1, "amount")

emaFast = ta.ema(close, fastEmaPeriod)
emaSlow = ta.ema(close, slowEmaPeriod)

buyCondition = longCondition and emaFast > emaSlow and close > open and close > emaFast
sellCondition = shortCondition and emaFast < emaSlow and close < open and close < emaFast

if buyCondition and strategy.position_size == 0
    strategy.entry("long", strategy.long, amount)
    strategy.exit("exit_long", "long", amount, loss=loss, trail_points=trailPoints, trail_offset=trailOffset)
if sellCondition and strategy.position_size == 0
    strategy.entry("short", strategy.short, amount)
    strategy.exit("exit_short", "short", amount, loss=loss, trail_points=trailPoints, trail_offset=trailOffset)
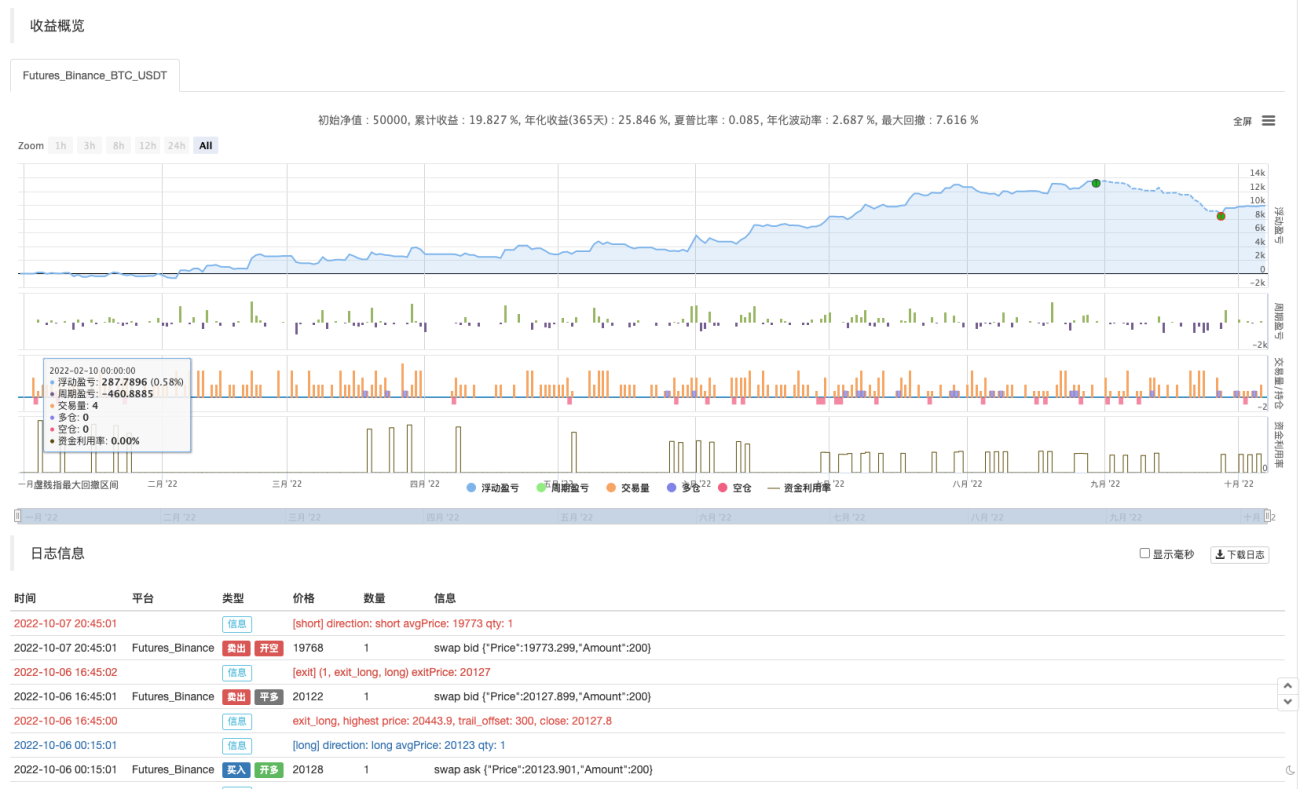
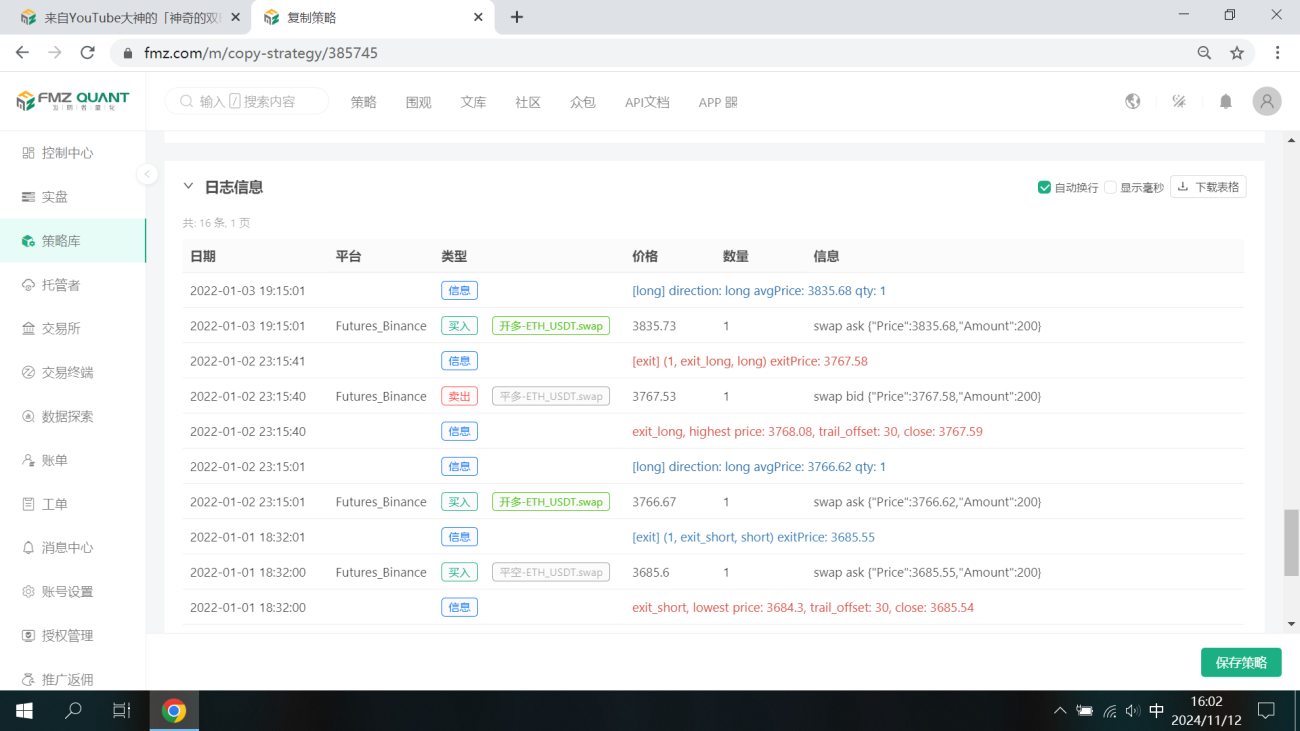
回测测试
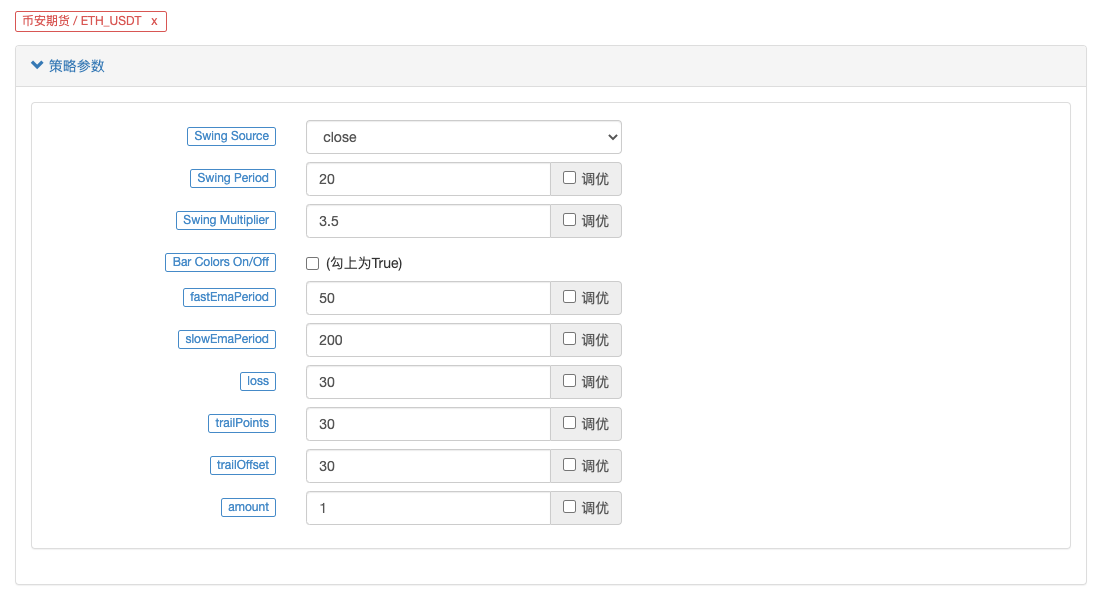
回测测试时间范围选取从2022年1月到2022年10月,K线周期为15分钟,使用收盘价模型回测。市场选择Binance的ETH_USDT永续合约。参数设置按照出处视频中所说快线50周期,慢线200周期,其它参数默认不变。止损、跟踪止盈点数我主观一点,就设置30个点位。
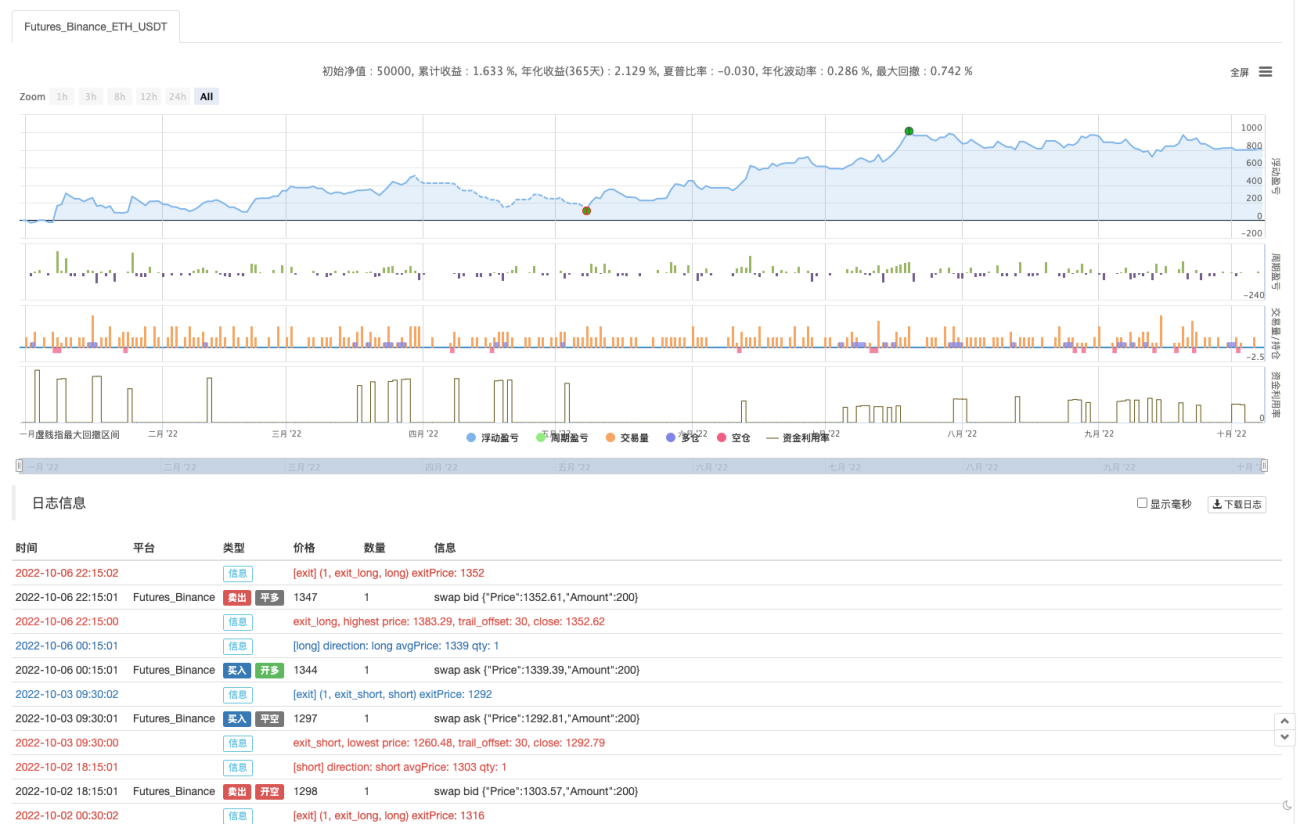
回测结果马马虎虎,多次回测看来止盈止损这些参数对回测结果有些影响。感觉这个方面还需要再优化设计。不过策略信号触发交易后胜率还是可以的。
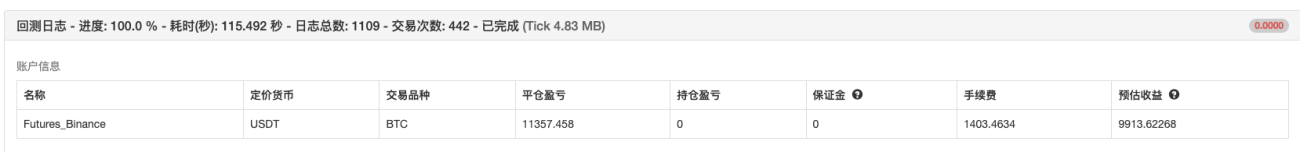
我们换一个BTC_USDT永续合约试试看:
结果在BTC上回测也很炸裂:
策略地址:https://www.fmz.com/strategy/385745
看来这个交易方法对于趋势的拿捏还是比较靠谱的,可以根据这个思路继续优化设计。本期文章我们不仅了解了一个双均线策略的思路,也了解了如何把油管(youtube)上大神的策略拿来加工、学习。OK,以上策略代码仅仅是小编我抛砖引玉,回测结果也并不代表具体实盘效果,对于策略代码、设计仅供参考。感谢您的支持,我们下期再见!


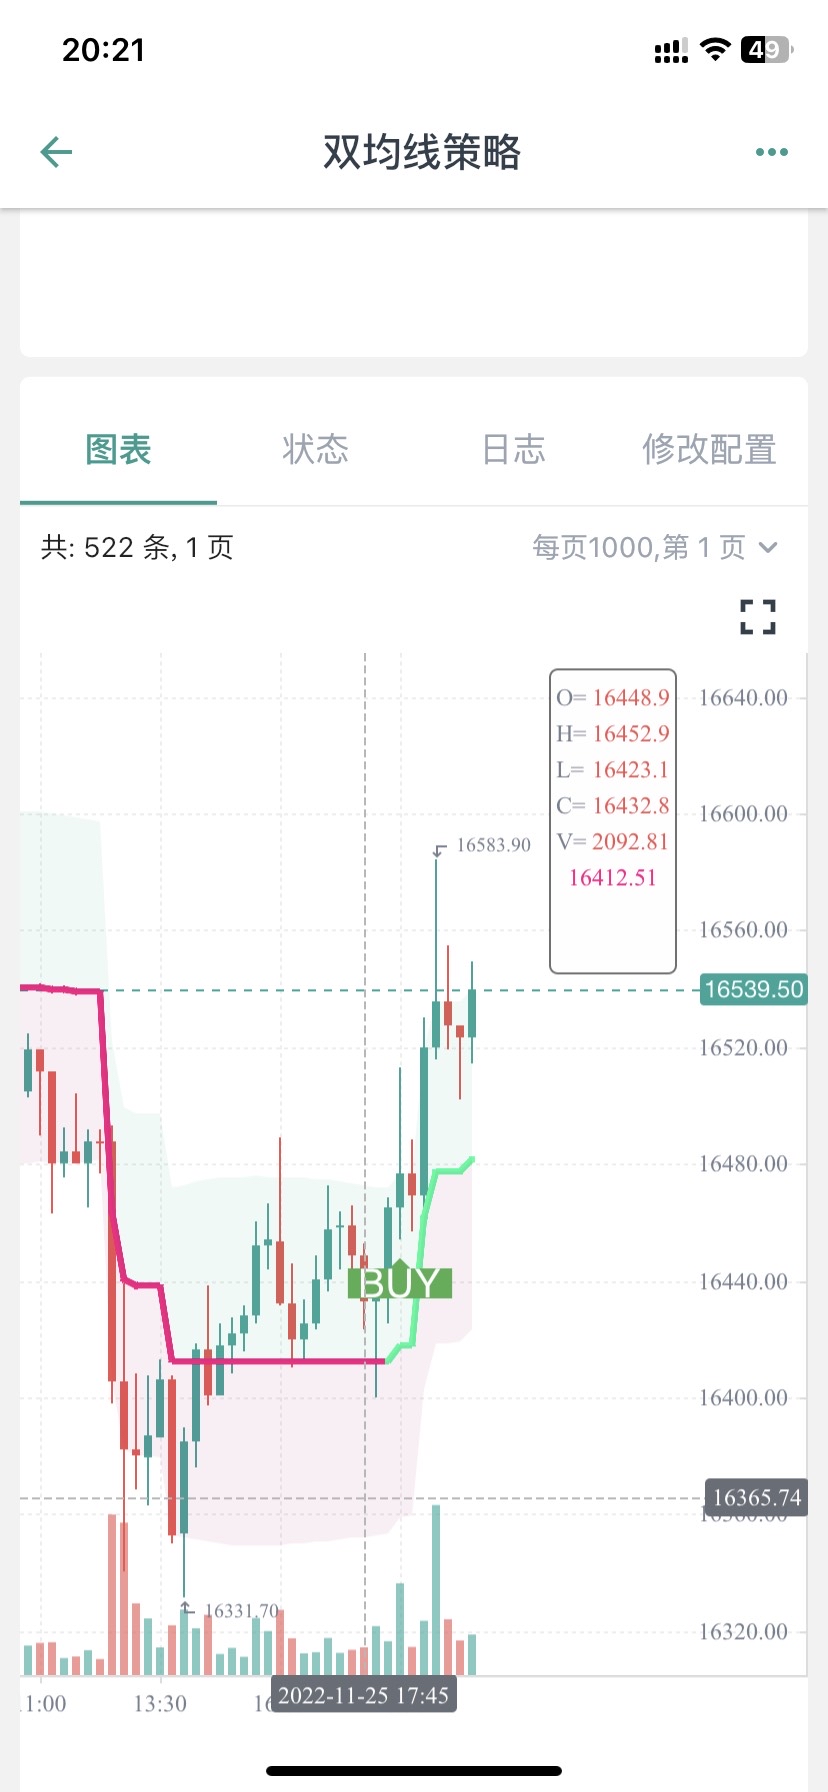


您好,这个是因为图表上显示的BUY标记只是文章中指标的信号显示,后面还结合了均线。
            //Plot Buy and Sell Labels
plotshape(longCondition, title = "Buy Signal", text ="BUY", textcolor = color.white, style=shape.labelup, size = size.normal, location=location.belowbar, color = color.new(color.green, 0))
plotshape(shortCondition, title = "Sell Signal", text ="SELL", textcolor = color.white, style=shape.labeldown, size = size.normal, location=location.abovebar, color = color.new(color.red, 0))
plotshape(longCondition, title = "Buy Signal", text ="BUY 画图显示时,只是longCondition条件符合了。
下单条件在这一块:
            if buyCondition and strategy.position_size == 0
    strategy.entry("long", strategy.long, amount)
    strategy.exit("exit_long", "long", amount, loss=loss, trail_points=trailPoints, trail_offset=trailOffset)
if sellCondition and strategy.position_size == 0
    strategy.entry("short", strategy.short, amount)
    strategy.exit("exit_short", "short", amount, loss=loss, trail_points=trailPoints, trail_offset=trailOffset)

梦大,建议从油管找两三个具有代表性的,改写难度较大,函数、参数、运算方式较多的策略做几个文字版的教程,比如带有类似【line.delete】这样的。(不需要策略盈利,就算是亏损的策略也无所谓,主要是用来学习写策略)。
我现在用这个双均线的策略,已经学会改一些不是非常复杂的组合策略了,改了十几个组合策略,其中有一两个确实是21年22年数据回测结果非常不错的,也已经在跑实盘测试了,但是遇到复杂函数参数运算这种【比如提示:line: 62 Could not find function or function reference 'line.delete',】而在FMZ PINE Script 文档并没有找到line.delete相关解释,用法说明,就懵圈了,所以希望梦大能弄点儿复杂策略改写一下,当然注释也多一些最好。就更方便学习了。[抱拳]
谢谢梦大。


梦大,请教下,PINE可以写复杂点儿的止盈方式吗?比如分层级止盈这样的???谢谢。
如果PINE可以和JS混编就好了,比如用PINE写指标,JS写交易部分就方便多了。。。。。
好的,谢谢梦大,另外请教下,PINE回测时间区间有限制吗?我选择2021年1月1日,到2022年10月11日,提示错误:
RuntimeError: abort(undefined) at Error at jsStackTrace (eval at self.onmessage (https://www.fmz.com/scripts/worker_detours.393054f7.js:1:147), <anonymous>:1:2096171) at stackTrace (eval at self.onmessage (https://www.fmz.com/scripts/worker_detours.393054f7.js:1:147), <anonymous>:1:2096345) at abort (eval at self.onmessage (https://www.fmz.com/scripts/worker_detours.393054f7.js:1:147), <anonymous>:1:2092408) at _abort (eval at self.onmessage (https://www.fmz.com/scripts/worker_detours.393054f7.js:1:147), <anonymous>:1:2137287) at <anonymous>:wasm-function[1297]:0x76bdc at <anonymous>:wasm-function[466]:0x3d789 at <anonymous>:wasm-function[477]:0x42e6b at <anonymous>:wasm-function[471]:0x4149e at <anonymous>:wasm-function[453]:0x3bf18 at <anonymous>:wasm-function[173]:0x13122
但是如果不改时间段就正常回测了。。。。 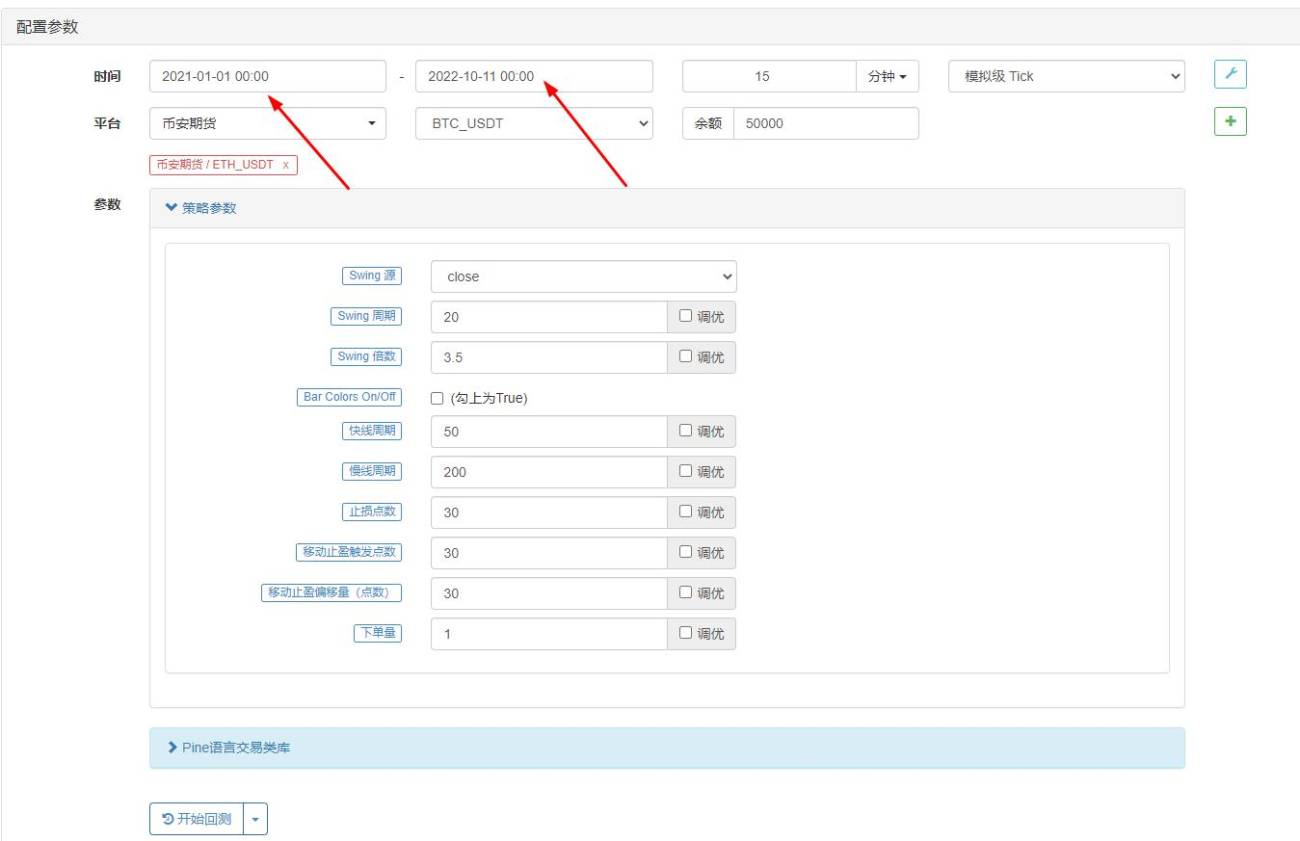

- 1