
Teach you to add multi-chart support to the strategy
Especially when writing trend strategies, sometimes you are confused by the trigger conditions of various indicators. At this time, it is urgent to visualize the data for analysis and viewing. When adding a single chart to a strategy, you can use the "Drawing Library" template to draw a chart directly. However, sometimes it is necessary to have multiple charts with different K-line periods, or even use the Y-axis separately for indicators. In this way, the drawing code needs to be implemented separately.
Here is an example for reference. I will comment on the sample code line by line. When you finish reading the code, you will have a new understanding of adding chart support to the strategy.
/*backtest
start: 2019-07-01 00:00:00
end: 2019-08-24 00:00:00
period: 1h
exchanges: [{"eid":"Futures_OKCoin","currency":"BTC_USD"}]
args: [["IsSynthesisDayKL",true]]
*/
var chart0 = {
__isStock: true,
// /*
extension: {
layout: 'single',
height: 300,
},
// */
title : { text : 'Daily K-line chart'},
xAxis: { type: 'datetime'},
series : [
{
type: 'candlestick',
name: 'r',
id: 'r',
data: []
}
]
}
var chart1 = {
__isStock: true,
// /*
extension: {
layout: 'single',
height: 300,
},
// */
title : { text : 'EMA'},
xAxis: { type: 'datetime'},
series : [
{
type: 'candlestick',
name: 'r1',
id: 'r1',
data: []
}, {
type: 'line',
name: 'chart1_EMA1',
data: [],
}, {
type: 'line',
name: 'chart1_EMA2',
data: []
}
]
}
var chart2 = {
__isStock: true,
// /*
extension: {
layout: 'single',
height: 300,
},
// */
title : { text : 'MACD'},
xAxis: { type: 'datetime'},
yAxis : [
{
title: {text: 'price'},
opposite: false
}, {
title:{text: "Indicator axis"},
opposite: true,
}
],
series : [
{
type: 'candlestick',
name: 'r2',
id: 'r2',
data: []
}, {
type: 'line',
yAxis: 1,
name: 'dif',
data: []
}, {
type: 'line',
yAxis: 1,
name: 'dea',
data: []
}
]
}
function CreatePlotter (e, chart) {
var obj = {} // Declare an empty object for adding methods in the following code, and finally return this object, that is, the constructed drawing object.
obj.e = e // The reference to the exchange object passed by the parameter is assigned to a property of the obj object.
obj.params = {} // Constructed parameters
obj.params.EMA_param1 = 5 // We preset the parameters of some indicators on the chart to be used in the calculation of the indicator, for example, an EMA indicator line parameter.
obj.params.EMA_param2 = 20 // The second EMA indicator line parameters, usually small parameters are called fast lines, large parameters are called slow lines.
obj.params.MACD_fast = 12 // MACD parameter
obj.params.MACD_slow = 26 // MACD parameter
obj.params.MACD_sig = 9 // MACD parameter
obj.runTime = {} // Used to store some data during runtime.
obj.runTime.arrPreBarTime = [0, 0, 0] // Store the timestamp of the previous bar of each K-line data for comparison.
obj.GetAllRecords = function () { // A method of the drawing object, used to get the K-line data, our example is used to display three charts at the same time, so, the function get three different periods of K-line data at the same time.
obj.r = _C(obj.e.GetRecords, PERIOD_H1) // The K-line data of the first chart, which is the 1-hour level K-line data.
Sleep(1000)
obj.r1 = _C(obj.e.GetRecords, PERIOD_M15) // The K-line data of the second chart, which is the 15-minute level K-line data.
Sleep(1000)
obj.r2 = _C(obj.e.GetRecords, PERIOD_D1) // The K-line data of the third chart, which is the daily level K-line data.
}
obj.Run = function () { // Execute the functions of drawing objects.
obj.Plot() // Execute the specific drawing code.
}
obj.CalcMACD = function (r, fast, slow, sig) { // MACD indicator calculation function, return MACD indicator data.
if (r.length <= Math.max(fast, slow, sig)) {
return false
}
return TA.MACD(r, fast, slow, sig)
}
obj.Plot = function () { // Focus section with specific drawing code.
obj.GetAllRecords() // Before each plot, update all K-line data first.
var arr = [obj.r, obj.r1, obj.r2] // Put all K-line data in an array and traverse it.
var arrKIndex = [0, 1, 4] // Indexing of K-line data series in chart objects.
for (var i = 0; i < arr.length; i++) { // Traversal operations
for (var j = 0; j < arr[i].length; j++) {
if (arr[i][j].Time == obj.runTime.arrPreBarTime[i]) { // When the last bar of the K-line data is not updated, we only update the data and do not add it. Note that when the chart.add function is called, the last parameter uses -1, which means that the data is updated and not added.
chart.add(arrKIndex[i], [arr[i][j].Time, arr[i][j].Open, arr[i][j].High, arr[i][j].Low, arr[i][j].Close], -1)
if (i == 1) { // Update the EMA indicator data in the second chart.
var nowR = arr[i].slice(0, j + 1)
var ema1 = TA.EMA(nowR, obj.params.EMA_param1)
var ema2 = TA.EMA(nowR, obj.params.EMA_param2)
if (obj.r2.length <= obj.params.EMA_param1 || obj.r2.length <= obj.params.EMA_param2 || isNaN(ema1[j]) || isNaN(ema2[j])) {
continue
}
chart.add(2, [arr[i][j].Time, ema1[ema1.length - 1]], -1)
chart.add(3, [arr[i][j].Time, ema2[ema2.length - 1]], -1)
} else if (i == 2) { // Update the MACD indicator data in the third chart
var nowR = arr[i].slice(0, j + 1)
var macd = obj.CalcMACD(nowR, obj.params.MACD_fast, obj.params.MACD_slow, obj.params.MACD_sig)
if (!macd) {
continue
}
var dif = macd[0]
var dea = macd[1]
chart.add(5, [arr[i][j].Time, dif[dif.length - 1]], -1)
chart.add(6, [arr[i][j].Time, dea[dea.length - 1]], -1)
}
} else if (arr[i][j].Time > obj.runTime.arrPreBarTime[i]) { // When the last bar of the current K-line data is larger than the last bar timestamp recorded previously, it indicates that a new bar has been generated for the K-line. At this time, a new bar and a new indicator data point should be added.
obj.runTime.arrPreBarTime[i] = arr[i][j].Time // Update the record of the last bar timestamp for the next comparison. If the next timestamp is the same, data will not be added unless a new bar is generated.
chart.add(arrKIndex[i], [arr[i][j].Time, arr[i][j].Open, arr[i][j].High, arr[i][j].Low, arr[i][j].Close])
if (i == 1) {
var nowR = arr[i].slice(0, j + 1)
var ema1 = TA.EMA(nowR, obj.params.EMA_param1)
var ema2 = TA.EMA(nowR, obj.params.EMA_param2)
if (nowR.length <= obj.params.EMA_param1 || nowR.length <= obj.params.EMA_param2 || isNaN(ema1[ema1.length - 1]) || isNaN(ema2[ema2.length - 1])) {
continue
}
chart.add(2, [arr[i][j].Time, ema1[ema1.length - 1]])
chart.add(3, [arr[i][j].Time, ema2[ema2.length - 1]])
} else if (i == 2) {
var nowR = arr[i].slice(0, j + 1)
var macd = obj.CalcMACD(nowR, obj.params.MACD_fast, obj.params.MACD_slow, obj.params.MACD_sig)
if (!macd) {
continue
}
var dif = macd[0]
var dea = macd[1]
chart.add(5, [arr[i][j].Time, dif[dif.length - 1]])
chart.add(6, [arr[i][j].Time, dea[dea.length - 1]])
}
}
}
}
}
obj.Plot()
return obj
}
function main () {
var chart = Chart([chart0, chart1, chart2])
chart.reset()
exchange.SetContractType("quarter")
var plotter = CreatePlotter(exchange, chart)
while (true) {
plotter.Run()
Sleep(1000)
}
}
We start by looking at the main function:
            function main () {                                  // Strategy entry function, of course, this strategy does not do anything, there are no transactions, just drawing charts.
    var chart = Chart([chart0, chart1, chart2])     // chart0, chart1, chart2 are pre-declared chart configuration objects, call the Chart function is to load the chart configuration, return a chart control object chart.
    chart.reset()                                   // Call the reset method of the chart control object chart to reset the chart.

    exchange.SetContractType("quarter")             // The backtest configuration is OKX futures, so here to set the contract, the contract is set to quarter.
    var plotter = CreatePlotter(exchange, chart)    // Call the CreatePlotter function to generate the plotter object -- plotter.
    while (true) {
        plotter.Run()                               // Execute drawing object plotter member function Run to draw.
        Sleep(1000)                                 // The drawing object plotter is responsible for "how to draw", and the chart control object chart is responsible for specific drawing. The former is implemented by our code, and the latter is the control object returned by the underlying API function of the system.
    }
}
Next, we can see how the CreatePlotter function implements the drawing function when constructing a drawing object. We can see that in the code var plotter=CreatePlotter(exchange, chart), when constructing a drawing object plotter, exchange and chart are passed in. The former is used to obtain K-line data (by calling exchange.GetRecords), and the latter is used to operate the chart and add data to the chart.
The most important part of the plot is the Plot function. Comments have been written in the code.
Backtesting operation:
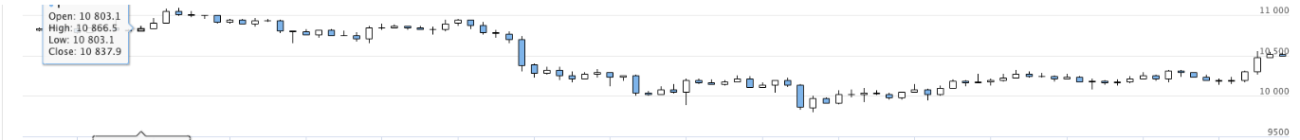
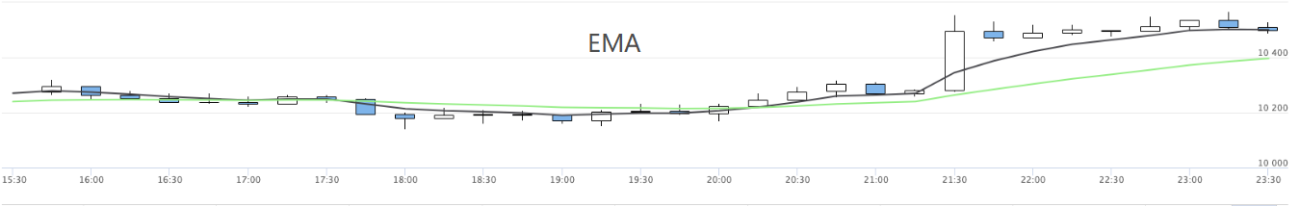
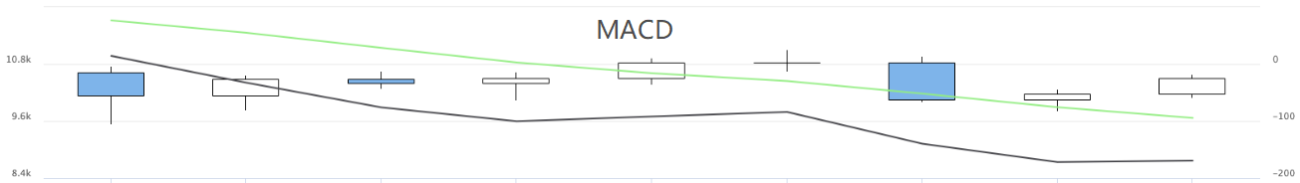
In this way, multiple charts of strategies can be displayed.
- 1