
Application of the combination strategy of SMA and RSI relative strength index
The combination of SMA and RSI
As for the SMA strategy, in previous articles, it has been mentioned many times and there are many practical strategies for readers to choose from. Because of its great advantages in trend tracking, SMA strategy has always been valued by many CTA strategy lovers. However, for the market, most of the time, it is still volatile. It is necessary to add some indicators for the judgment of volatility to use in combination with trend strategy. This will not only increase the potential profitability, but also greatly benefit the fund management. The utilization rate and security of funds have been greatly improved.
In this article, we will introduce one of the most popular oscillators: the relative strength index (RSI). You may have read some general articles about RSI; However, in this article, I will introduce a trading strategy that can be deployed on the FMZ Quant platform in combination with the SMA strategy.
Principle and application of RSI index
Before we delve into the strategy, let's understand the RSI indicators first and provide you with some basic introduction.
The Relative strength index (RSI) is one of the most popular indicators in the market.
RSI is a basic indicator to measure the performance of a trading target against itself by comparing the strength of increasing days and decreasing days. The number is calculated and ranges from 0 to 100. A reading above 70 is considered bullish, while a reading below 30 is considered bearish.
Relative strength index formula
RSI was developed by J. Welles Wilder and detailed in his book "New Concept of Technology Trading System" in June 1978. For all hard core technical analysts, the following is an example of the relative strength index formula.
The default setting of RSI is 14 days, so you can calculate it according to the following formula:
**Relative strength = 1.25 (average increase of the last 13 K-lines) + 0.25 (current increase)/(0.75 (average decrease of the last 13 K-lines) + 0 (current decrease))
Relative strength = 1.50 / 0.75 = 2
RSI = 100 - [100 /(1+2)] = 66.67**
Now that we know the formula of the relative strength index, let's analyze how to use this powerful indicator.
Most traders using the relative strength index only need to buy the trading target when the index reaches 30 and sell when it reaches 70. But if you do so, you will incur losses if you buy or sell according to this rule. The market will not reward anyone for those obvious things. This does not mean that the simple method does not work, but the simple method that everyone follows has a lower loss. So as we mentioned at the beginning, we need to introduce the SMA to assist in judgment.
Compile and apply the SMA plus RSI strategy on the FMZ Quant platform
Write it down, we will deploy this strategy to the FMZ Quant platform, and we still use the simple and understandable Mylanguage for programming.
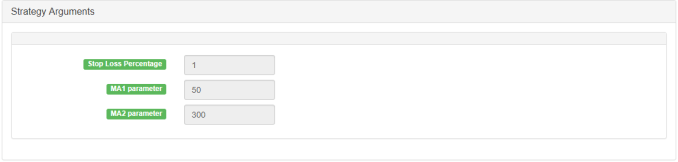
Strategy name: combination strategy of SMA and RSI relative strength index
Period: 15 minutes, 30 minutes, etc
Support: commodity futures, digital currency
Main chart:
MA 1, formula: MA1 ^^ EMA (C, N1);
MA 2, formula: MA2 ^^ EMA (C, N2);
Sub-chart:
            RSI, formula:
RSIVALUE:SMA(MAX(CLOSE-REF(CLOSE,1),0),LENGTH,1)/SMA(ABS(CLOSE-REF(CLOSE,1)),LENGTH,1)*100;
Source code:
            MA1^^EMA(C,N1);
MA2^^EMA(C,N2);

LENGTH:=9;
OVERBOUGHT:=70;
OVERSOLD:=100-OVERBOUGHT;
RSIVALUE:SMA(MAX(CLOSE-REF(CLOSE,1),0),LENGTH,1)/SMA(ABS(CLOSE-REF(CLOSE,1)),LENGTH,1)*100;
BUYK:=BKVOL=0 AND BARPOS>N2 AND MA1>MA2 AND C>MAX(MA1,MA2) AND CROSSUP(RSIVALUE,OVERBOUGHT);
SELLK:=SKVOL=0 AND BARPOS>N2 AND MA1<MA2 AND C<MIN(MA1,MA2) AND CROSSDOWN(RSIVALUE,OVERSOLD);
SELLY:=MA1<MA2 AND C>BKPRICE*(1+SLOSS*0.01);
BUYY:=MA1>MA2 AND C<SKPRICE*(1-SLOSS*0.01);
SELLS:=C<BKPRICE*(1-SLOSS*0.01);
BUYS:=C>SKPRICE*(1+SLOSS*0.01);

BUYK,BK;
SELLK,SK;
SELLY,SP(BKVOL);
BUYY,BP(SKVOL);
SELLS,SP(BKVOL);
BUYS,BP(SKVOL);
For the strategy source code, please refer to: https://www.fmz.com/strategy/128250.
- 1