
Principle and compilation of stop-loss model
Why stop-loss?
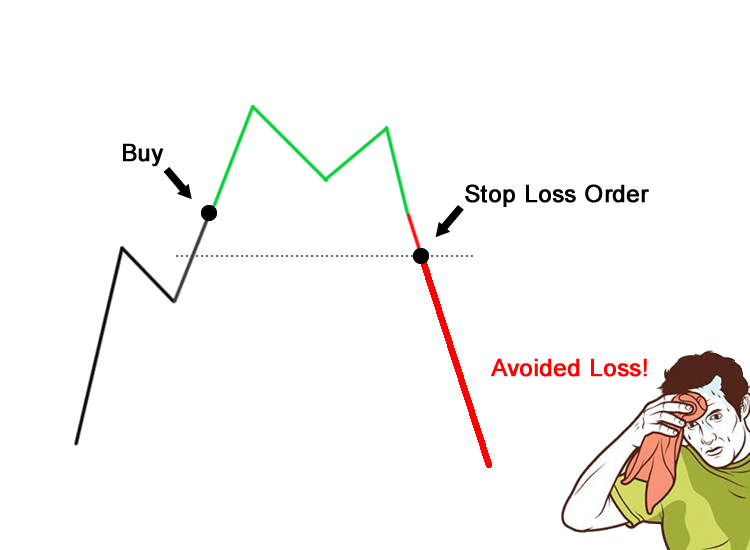
Alligator Principle
Suppose a crocodile bites your feet. If you try to break free your feet with your hands, the crocodile will bite your feet and hands at the same time. The more you struggle, the more you will be bitten. So, if the crocodile bites your feet, your only chance is to sacrifice one foot.
In the capital market, whether it is digital currency or commodity futures, the Alligator Principle is that when you find that your transaction deviates from the direction of the market, you must stop the loss immediately without any delay or any luck.
Preserving your capital always comes first!
Investment tycoon
I believe that the most important thing is always to preserve capital, which is the cornerstone of the investment strategy.
Failed investors
The only investment goal is to "make a lot of money". As a result, he often could not preserve his capital.
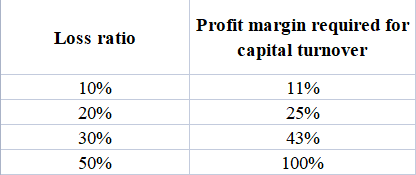
Investment tycoons know that it is easier to avoid losing money than to make money. If you lose 50% of your investment capital, you must double your capital to return to the original starting point.
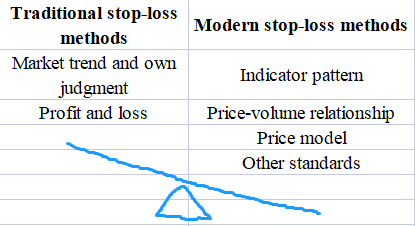
Spatial stop-loss method
The key is to set the stop-loss price above or below a certain benchmark position to achieve a preventive approach.
For example:
Long stop-loss - set stop-loss below the support line based on the support line;
Short stop-loss - set a stop-loss above the resistance line based on the resistance line.
This stop-loss method belongs to the price model method, which is equivalent to setting the "maximum limit" of stop-loss, in order to protect yourself and avoid the disaster caused by emotional interference. After we established our position, if we wait passively for the price to fall to the maximum stop-loss line, you will be passive. The preset maximum stop-loss limit can only play a very good role in blocking when the market changes direction suddenly.
Limit and stop-loss method
stop-loss strategy: the stop-loss position is preset before opening the position.
Strategy example: stop-loss at a fixed price point, and stop-loss at 3% or 5% below the buying price. Once the price falls below the stop-loss position effectively, leave the market immediately. The "effective decrease" here refers to the closing price generally.
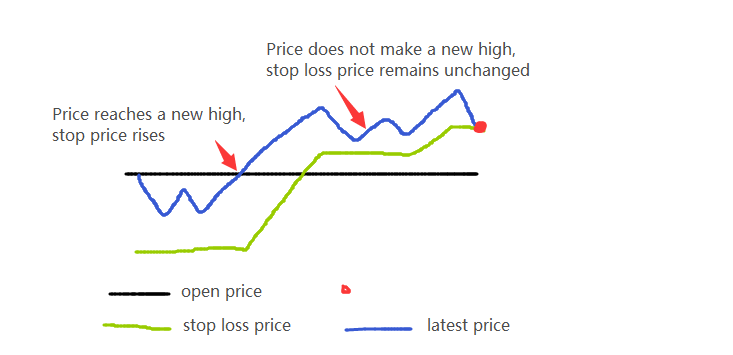
Follow the trend floating stop-loss method
Stop-loss strategy: based on the profit and loss at the time of setting the stop-loss, stop-loss after withdrawing N price points from the maximum profit and loss.
Strategy example: if you make a long order for PTA at 8946, and set the stop-loss when the price goes back to 10 (8936), when the PTA price rises to 8950, the stop-loss price will be repositioned at 8940 automatically.
Withdrawal stop-loss method
If the price rises first after buying, and then falls after reaching a relative high point, then you can set the decline range from the relative high point as the stop-loss target, and the specific value of this range is also determined by your personal situation. In addition, we can also add the factor of decreasing time (i.e. days). For example, we set a stop-loss by withdrawing 5% within 3 days. The withdrawal stop-loss is more often used in the case of stop profit actually.
Introduction to modern stop-loss methods
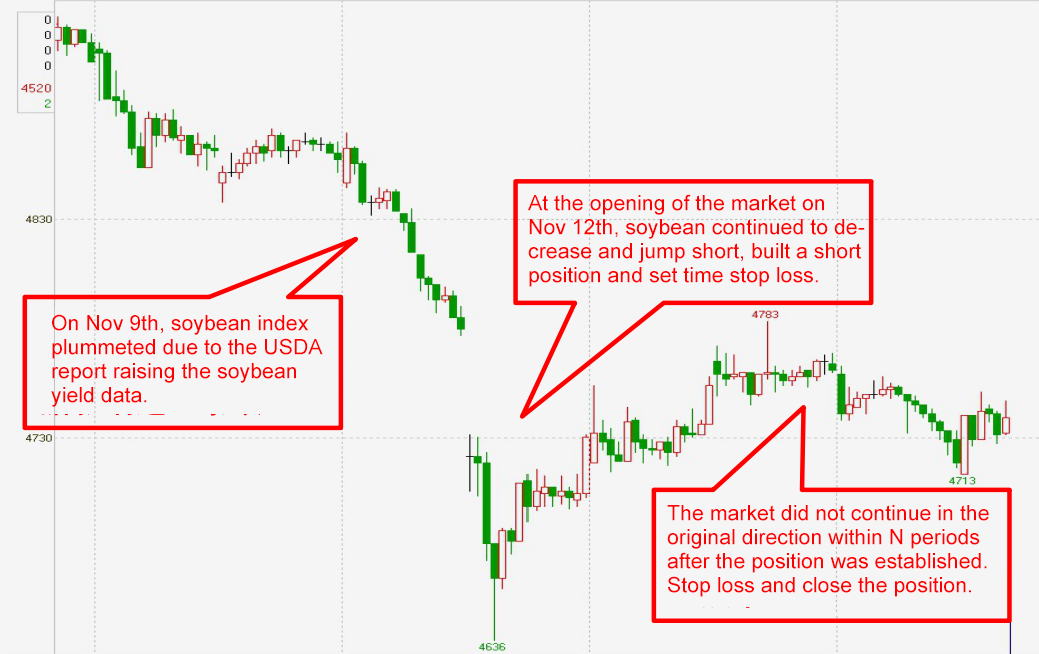
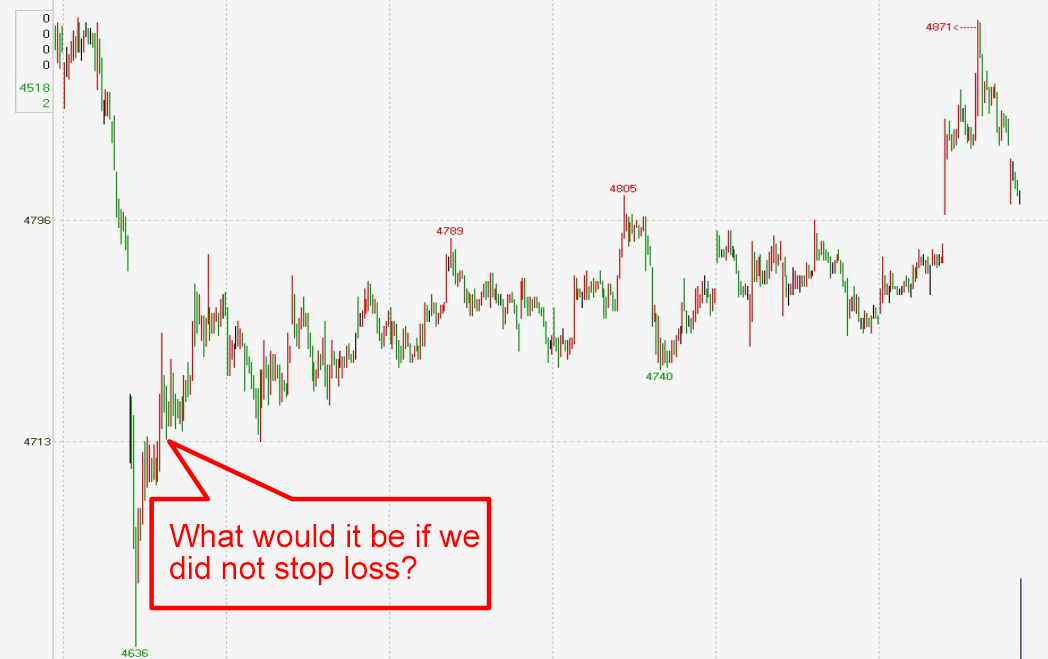
Time stop-loss method
Application: intra-day ultra-short trading mode
Key: After the position is established, there is no favorable fluctuation in the market for a certain period of time, stop-loss and leave the market, and look for the opportunity to enter the market again.
Trading principle: When the price moves sharply in an instant under the influence of certain factors, such as the impact of the external market, the breakthrough and false breakthrough of the intraday support level and pressure level, and the sudden news, the profit can be earned by quick entry and exit in the trend or against the trend.
The practice of time stop-loss is forward-looking and belongs to other stop-loss methods. Time stop-loss also involves the issue of opening time. For example, we should strive to open the position at the moment of starting the critical point (the qualitative change point), and expect that there will be a frenzy of buying the winners, but it's only an expectation. If it does not happen, then we should close the position and leave the market, and do not wait until the decrease support or crossover resistance before stopping the loss.
Typical time stop-loss:
Horizontal stop-loss
-
Stop-loss strategy: set a stop-loss target for the time that the price crosses within a certain range after buying.
-
Strategic distance: stop-loss if the increase rate does not reach 5% within 5 days after buying.
-
Generally, horizontal stop-loss requires time stop-loss and maximum loss method to be used at the same time to control the risk comprehensively.
Technical stop-loss method
Key: The technical stop-loss method is a more complex stop-loss method. It combines the stop-loss setting with the technical analysis. After eliminating the random fluctuation of the market, it sets the stop-loss order at the key technical level to avoid further expansion of the loss.
Application: The technical stop-loss method requires investors to have strong technical analysis ability and self-control. Compared with the former method, the technical stop-loss method has higher requirements for investors, and it is difficult to find a fixed model. Generally speaking, using the technical stop-loss method is nothing more than small losses to bet great profits.
For example, after buying off the track of the increasing channel, wait for the end of the increasing trend to close the position, and set the stop-loss position near the relatively reliable average moving line, so that you can get the price difference by entering in low position and exiting in high position.
Typical technical stop-loss:
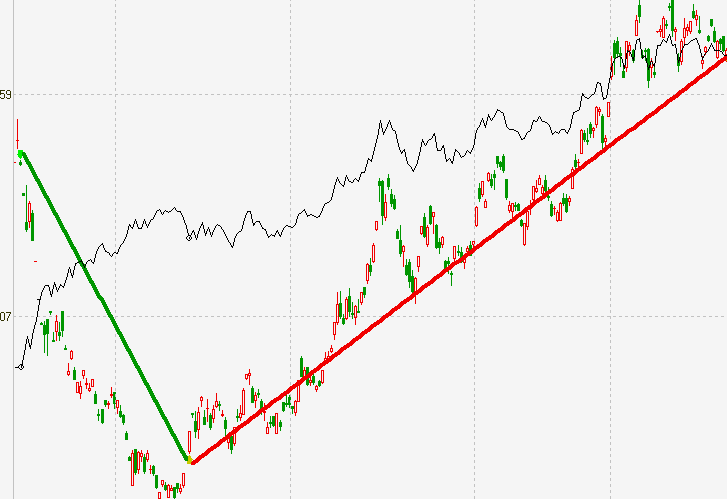
Trend tangent stop-loss:
Including the tangent of the price effectively falling below the trend line; The price effectively breaks Gann angle line 1 × 1 or 2 × 1 line; The price effectively breaks through the lower track of the increasing channel.
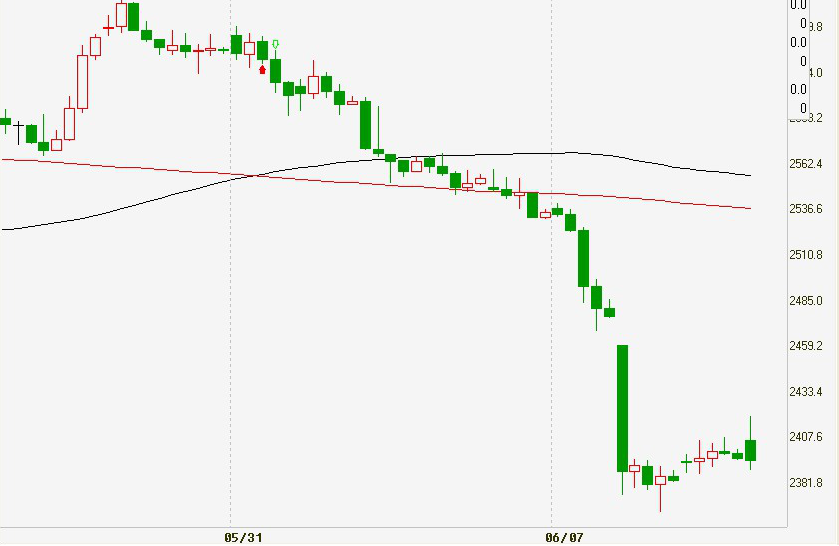
Morphological stop-loss:
Including the stock price broke the neckline level of the head and shoulders, M-head, round top and other head patterns; price jumped down to break the gap, etc.
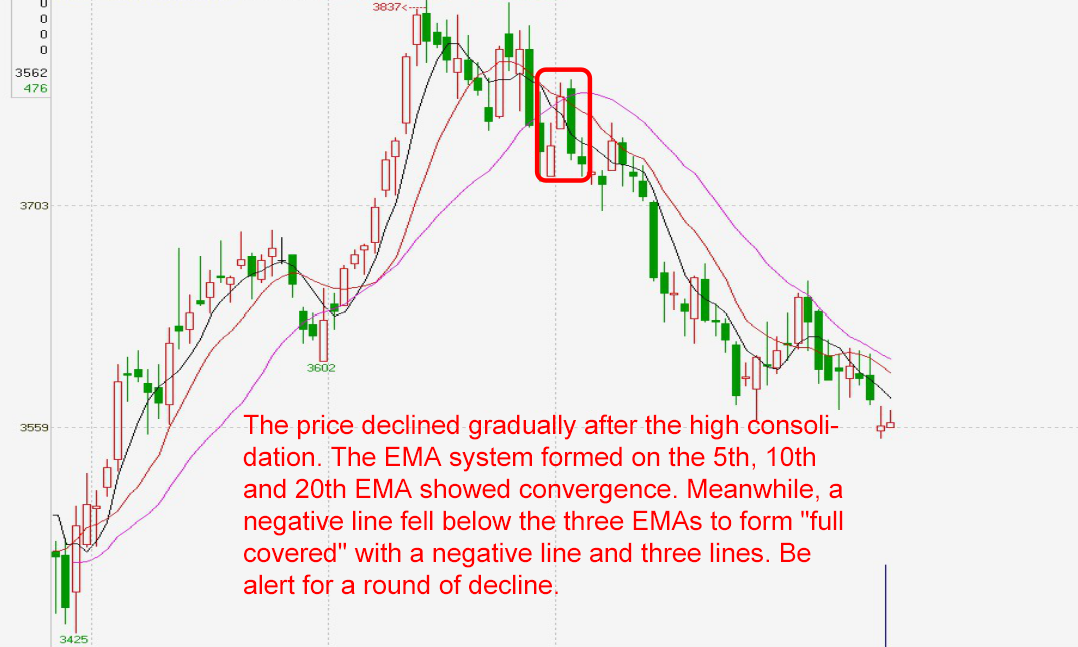
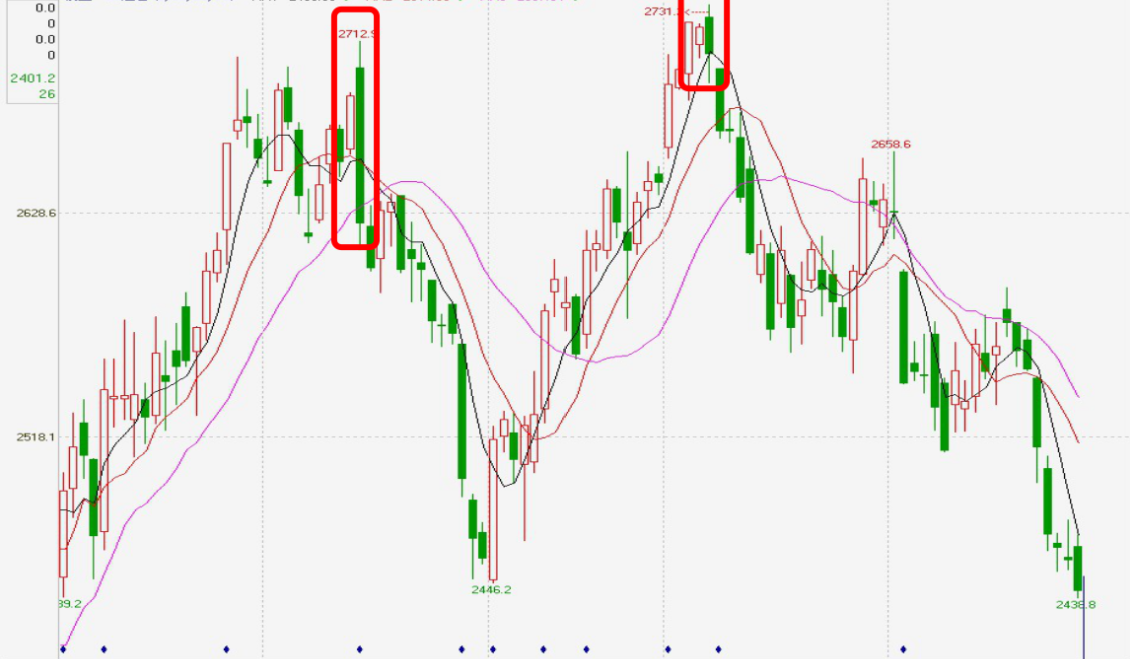
K-line stop-loss:
Including short shots with two negative lines sandwiched with one positive line, and one negative line followed by two negative and positive lines, or full covered status with one negative line break three lines, and the appearance of the typical K-line combinations, such as twilight star, the 2nd K-line piercing the 1st K-line all, the stars of shooting, the two flying crows, and the three crows hanging on treetops and so on.
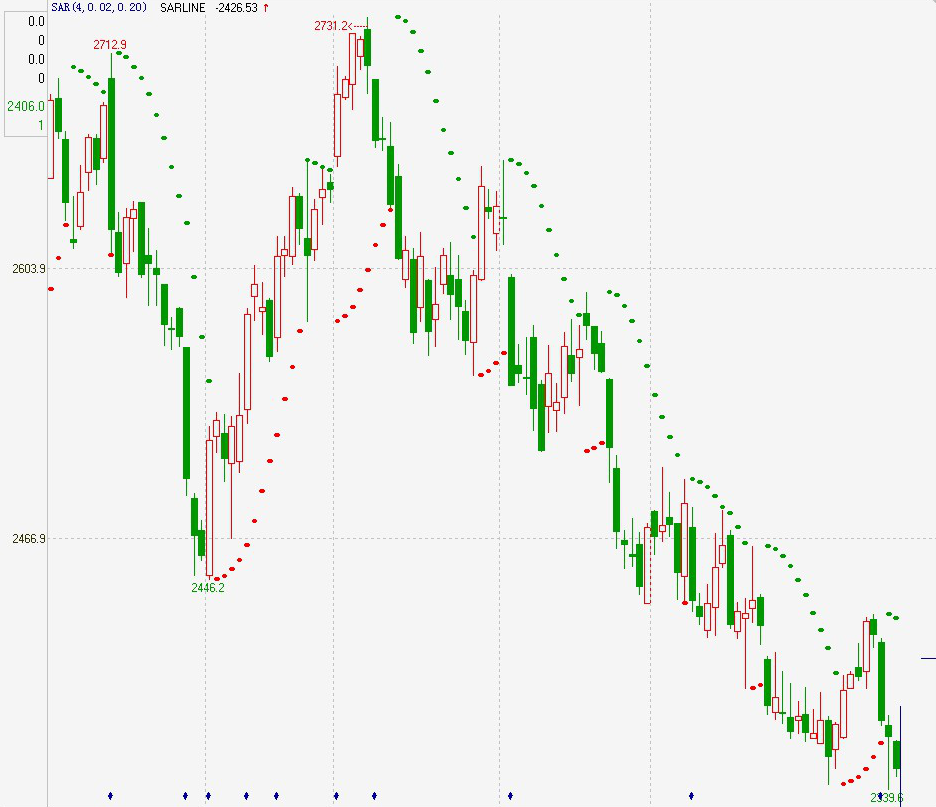
Index stop-loss:
According to the technical indicators issued by the sell instructions, as a stop-loss signal, mainly including: MACD appeared green bar and formed a down cross; SAR down below the turning point and turned green, etc.. One of the simplest and most practical is the SAR Parabolic Turn indicator, also known as the Stop-Loss Point Turn operating system. SAR is like the patron saint of stock prices, once the upward speed can not keep up, or the stock price reverses down, SAR will keep a close eye on, if the stock price falls below SAR, it's the signal to close the position.
Statistical stop-loss method
In the selection of reference materials for stop-loss, we can select various reference standards. In addition to technical indicators, K-line shape, time and price space, many statistical variables are also important reference standards for setting stop-loss. Most of these statistical variables are based on statistics and mathematical principles, so we call them statistical stop-loss temporarily.
Typical statistical stop-loss:
Capital stop-loss-method:
This is the simplest stop-loss method. We control the risk at a fixed proportion of capital in each transaction. When we make money continuously, the proportion represents that the amount will increase, so we can invest more capital to make more profits. When we lose money continuously, we may reduce the loss on the contrary.
Compilation method of stop-loss model
Write several common stop-loss functions:
BKPRICE Return to the signal price of the last buying and opening of the data contract.
SKPRICE Return to the signal price of the last selling and opening of the data contract.
BKHIGH Return to the highest price from the last model buy opening position to the current one.
SKLOW Return to the lowest price from the last model sell opening position to the current one.
BARSBK Last buy opening signal position
BARSSK Last sell opening signal position
Limit price to stop-loss and stop-profit
            TMP1:=C<BKPRICE-M;
TMP2:=C>SKPRICE+M;

TMP3:=C>BKPRICE+M;
TMP4:=C<SKPRICE-M;
Trailing stop-loss
            HH:HHV(H,BARSBK); // High point since entering the market
LL:LLV(L,BARSSK); // Low point since entering the market
TMP1:=C<(HH-BKPRICE)*0.5+BKPRICE&&HH>BKPRICE+25; // Long position trailing stop-loss conditions
TMP2:=C>SKPRICE-(SKPRICE-LL)*0.5&&LL<SKPRICE-25; // Short position trailing stop-loss conditions
Examples of stop-loss models
Example 1: Double SMA System
Idea: Buy or sell when the 100-day SMA crosses the 350-day SMA
            MA1:MA(C,100);
MA2:MA(C,350); // Define double SMA
CROSS(MA1,MA2),BPK;
CROSS(MA2,MA1),SPK;
AUTOFILTER;
Thinking
-
If the conditions for crossing the closing positions have not been met and the trend has reversed, can we stop-loss immediately to reduce losses?
-
If it is profitable, can it maximize profit and let the position of closing position rise with the market?
Conversion: price limit stop-loss + trailing stop-profit
            // price limit stop-loss
C<BKPRICE-N,SP;
C>SKPRICE+N,BP;
// trailing stop-profit
C>BKPRICE&&C<BKHIGH-M,SP;
C<SKPRICE&&C>SKLOW+M,BP;
Note: N and M are price differences
Complete code:
            MA1:MA(C,100);
MA2:MA(C,350); // Define double SMA
CROSS(MA1,MA2),BK;
CROSS(MA2,MA1),SK; // Conversion model
CROSS(MA2,MA1)||C<BKPRICE-N||(C>BKPRICE&&C<BKHIGH-M),SP;
CROSS(MA1,MA2)||C>SKPRICE+N||(C<SKPRICE&&C>SKLOW+M),BP;
 // Limit price stop-loss + withdrawal stop-loss
AUTOFILTER; // Realize signal filtering
Example 2: Regression model of opening volatility
Idea: Break through the physical upper end of the first K-line on the day of the minute period, and go long. The price falls below the lowest price of the first K-line on the day or the market has passed for 10 minutes, close the position and exit; If it falls below the lower end of the entity of the first K-line of the day of the minute period, go short, and the price rises higher than the highest price of the first K-line of the day or the market has passed 10 minutes, close the position and exit.
            RKO:=VALUEWHEN(TIME=0900,O);// The opening price of the first K-line of the day in the minute period
RKC:=VALUEWHEN(TIME=0900,C);// The closing price of the first K-line of the day in the minute period
RKH:=VALUEWHEN(TIME=0900,H);// The highest price of the first K-line of the day in the minute period
RKL:=VALUEWHEN(TIME=0900,L);// The lowest price of the first K-line of the day in the minute period
CROSS(H,MAX(RKO,RKC))&&TIME<0910&&TIME>0900,BK;
CROSS(MIN(RKO,RKC),L)&&TIME<0910&&TIME>0900,SK;
C>RKH || TIME>=0910,BP;
C<RKL || TIME>=0910,SP;
AUTOFILTER;
// Applicable varieties, influenced by the external market and the opening volatility of the more violent varieties
Example of stop-loss model - time stop-loss:
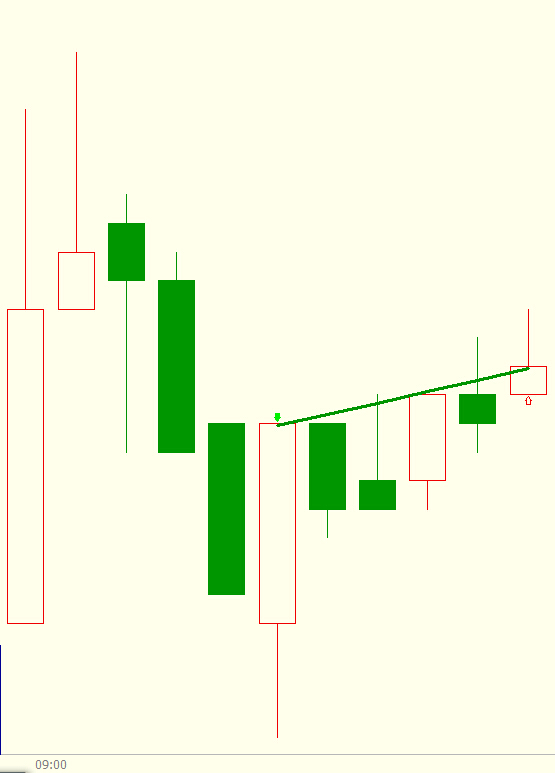
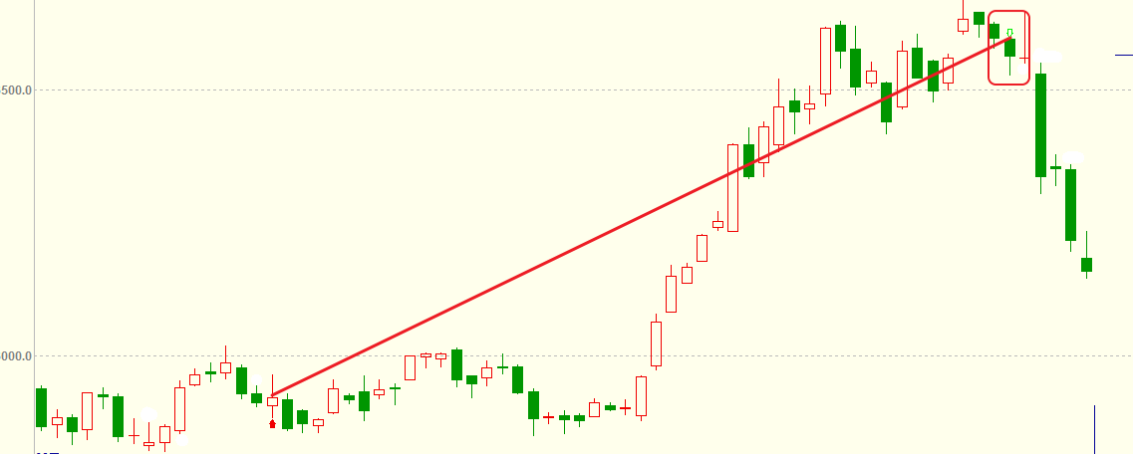
Example 3: Price breakthrough channel model
Idea: Use ATR to calculate the upper and lower tracks of the price channel. After the record high and the current highest price exceeds the closing price of the previous K-line plus a certain multiple of ATR, the long position enter the market, if the price crossovers the lower track, close the position and exit. After the record low and the current lowest price exceeds the closing price of the previous K-line minus a certain multiple of ATR, the short position enters the market, the price crossovers the upper track, close the position and exits.
            TR:=MAX(MAX((HIGH-LOW),ABS(REF(CLOSE,1)-HIGH)),ABS(REF(CLOSE,1)-LOW));
ATR:=MA(TR,26),COLORYELLOW; // Find the simple moving average of TR over 26 periods
C1:REF(C,1)+REF(ATR,1)*0.79; // Upper track
C2:REF(C,1)-REF(ATR,1)*0.79; // Lower track
HIGH>HHV(REF(HIGH,1),10)&&H>=REF(C,1)+REF(ATR,1)*0.79,BPK;
LOW<LLV(REF(L,1),10)&&L<=REF(C,1)-REF(ATR,1)*0.79,SPK;
CROSS(C2,C),SP; // The price breaks through the lower track, and the long position stop-loss is closed
CROSS(C,C1),BP; // The price breaks through the upper track, and the short position stop-loss is closed
AUTOFILTER;
Price breakthrough channel model:
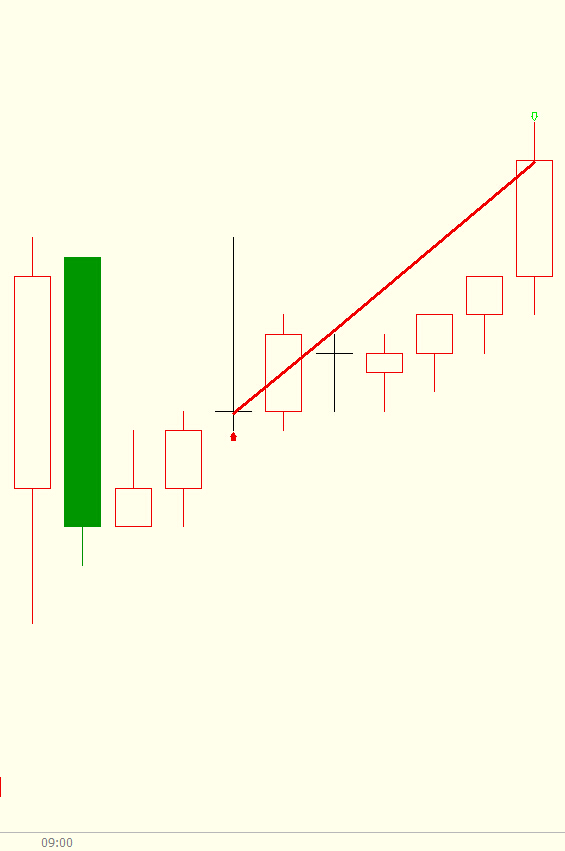
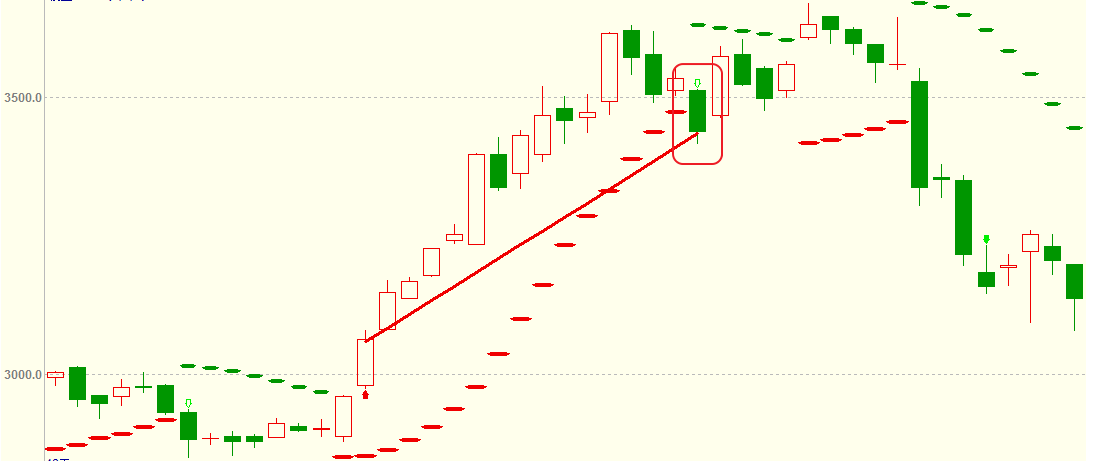
Example 4: Morphological stop-loss model
Idea: The difference between current price and MA is defined as DRD, the sum of DRD in N days divided by the sum of absolute value of DRD. Set 5 as the market entry threshold. If RDV>5, the market entry will be long, and the K-line will have a downward gap, and the market exit will be closed. Set - 5 as the threshold for entering the market. If RDV <- 5, enter the market and go short, and the K-line has an upward gap, and close the position and exit market.
            RMA:=MA(CLOSE,15);
DRD:=CLOSE-RMA; // Define the difference between the current price and MA as DRD
NDV:=SUM(DRD,15);
TDV:=SUM(ABS(DRD),15);
RDV:=VALUEWHEN(TDV>0,100*NDV/TDV); // The sum of 15 days DRD divided by the sum of the absolute value of DRD
RDV>5,BPK;
RDV<-5,SPK;
MAX(C,O)<REF(MIN(C,O),1),SP; // If there is a downward gap in the K-line, stop-loss of the long position
MIN(C,O)>REF(MAX(C,O),1),BP; // If there is an upward gap in the K-line, stop-loss of the short position
AUTOFILTER;
Morphological stop-loss model:
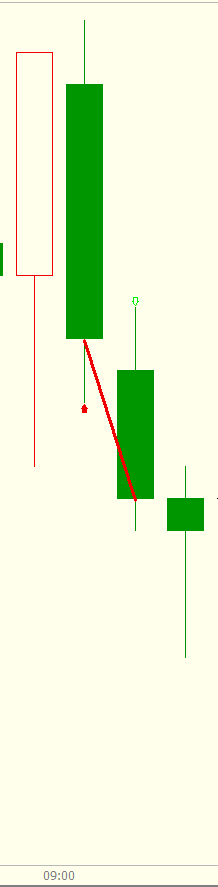
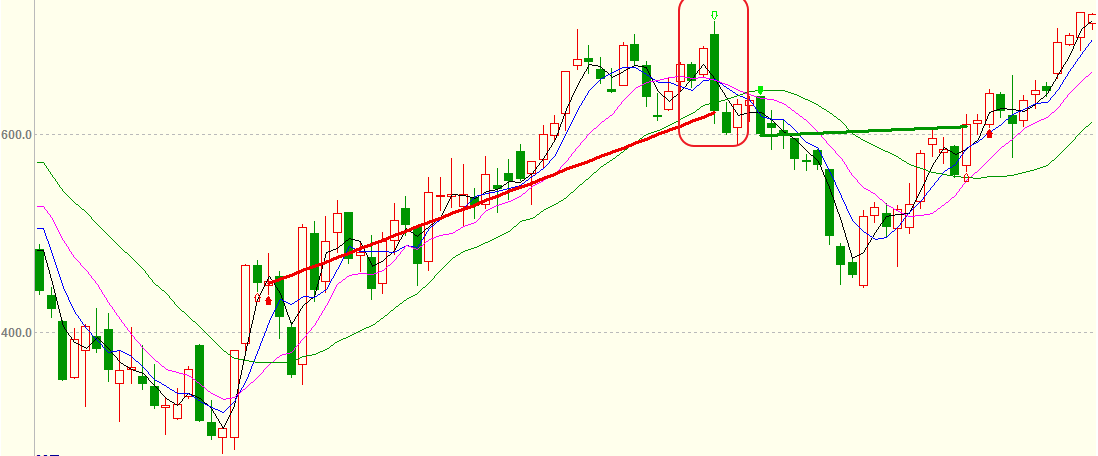
Example 5: K-line stop-loss model
Idea: When the two groups of moving averages are arranged in a long position and the current price is higher than the highest price of the previous K-line, enter the market to go long, and one negative line falls below the four moving averages to stop the long position loss. When the two groups of moving averages are in short position and the current price is lower than the lowest price of the last K-line, enter the market to go short, a positive line crossover four moving averages to stop the short position loss.
            MA3:MA(CLOSE,3);
MA5:MA(CLOSE,5);
MA10:MA(CLOSE,10);
MA20:MA(CLOSE,20); // SMA combinations
MA5>MA20&&MA3>MA10&&HIGH>=REF(HIGH,1),BPK;
MA5<MA20&&MA3<MA10&&LOW<=REF(LOW,1),SPK;
ISDOWN&&O>MAX1(MA3,MA5,MA10,MA20)&&C<MIN1(MA3,MA5,MA10,MA20),SP;
// One negative line falls below the four moving averages to stop the long position loss
ISUP&&C>MAX1(MA3,MA5,MA10,MA20)&&O<MIN1(MA3,MA5,MA10,MA20),BP;
// A positive line crossover four moving averages to stop the short position loss
AUTOFILTER;
K-line stop-loss model:
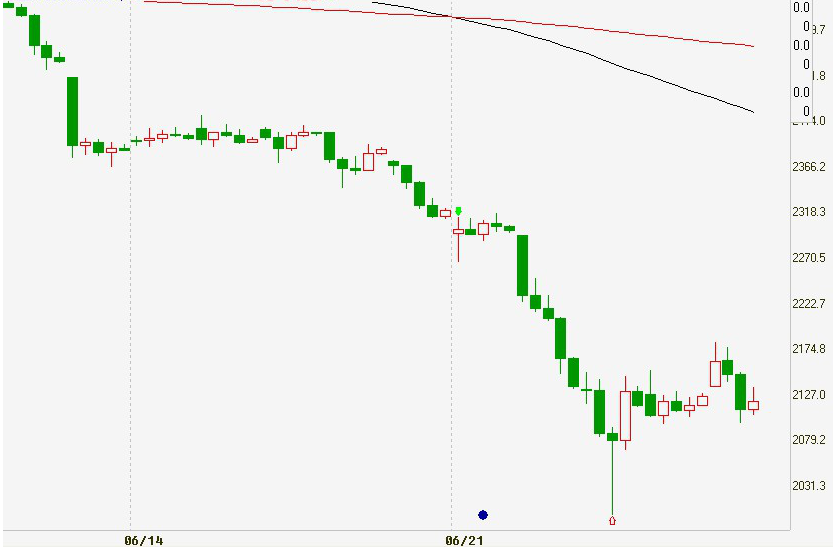
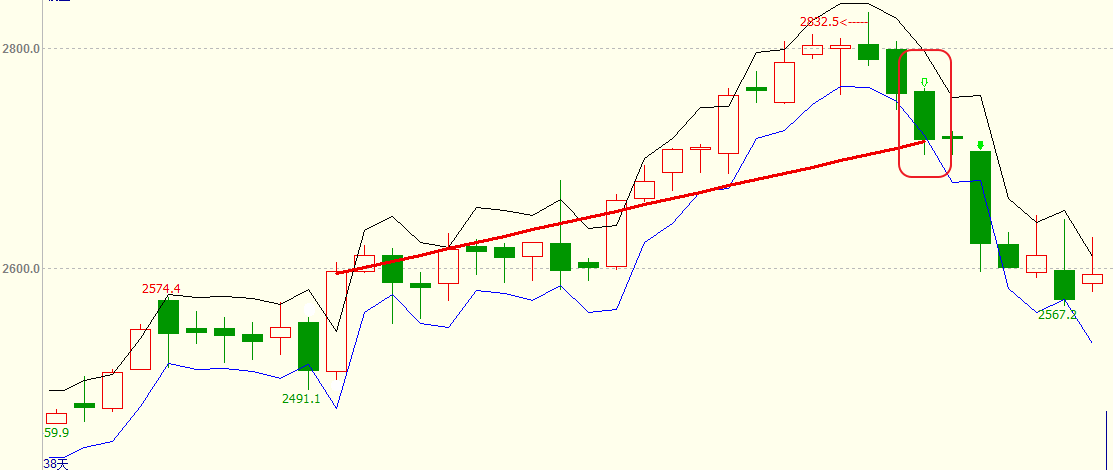
Example 6: Index stop-loss model based on BOLL and SAR
Idea: When the highest price is greater than the upper Bollinger Bands, enter the market and go long, the parabolic steering value crosses 0, and stop the long position loss. When the lowest price is less than the lower Bollinger Bands, enter the market and go short, the parabolic steering value goes down 0, and stop the short position loss.
            MID:=MA(CLOSE,26); // Find the average closing price of 26 periods, called the middle track of the Bollinger Bands
TMP2:=STD(CLOSE,26); // Find the standard deviation of the closing price over 26 periods
TOP:=MID+2*TMP2; // Bollinger Bands upper track
BOTTOM:=MID-2*TMP2; // Bollinger Bands lower track
STEP1:=2/100;
MVALUE1:=2/10;
SARLINE:SAR(4,STEP1,MVALUE1),CIRCLEDOT;
// Parabolic steering in 4 periods, step length of STEP1, and limit value of MVALUE1
HIGH>=TOP,BPK;
LOW<=BOTTOM,SPK;
CROSS(SARLINE,0),BP; // Parabolic steering value above 0, long position stop-loss
CROSS(0,SARLINE),SP; // Parabolic steering value below 0, short position stop-loss
AUTOFILTER;
The above is the general code framework of each stop-loss model. Readers can choose according to their own needs. The way to trade is to use various strategies and methods flexibly. The importance of stop-loss in a quantitative trading strategy is self-evident. When using the above models, readers should not copy them mechanically. They must check the applicability of their trading targets and models several times, and then conduct multiple back-testing of the simulation bot, make sure the model is correct, and then apply it to the real bot.
- 1