
This is a derivative of John Carter's "TTM Squeeze" volatility indicator, as discussed in his book "Mastering the Trade" (chapter 11).
Black crosses on the midline show that the market just entered a squeeze ( Bollinger Bands are with in Keltner Channel). This signifies low volatility , market preparing itself for an explosive move (up or down). Gray crosses signify "Squeeze release".
Mr.Carter suggests waiting till the first gray after a black cross, and taking a position in the direction of the momentum (for ex., if momentum value is above zero, go long). Exit the position when the momentum changes (increase or decrease --- signified by a color change). My (limited) experience with this shows, an additional indicator like ADX / WaveTrend, is needed to not miss good entry points. Also, Mr.Carter uses simple momentum indicator , while I have used a different method (linreg based) to plot the histogram.
回测
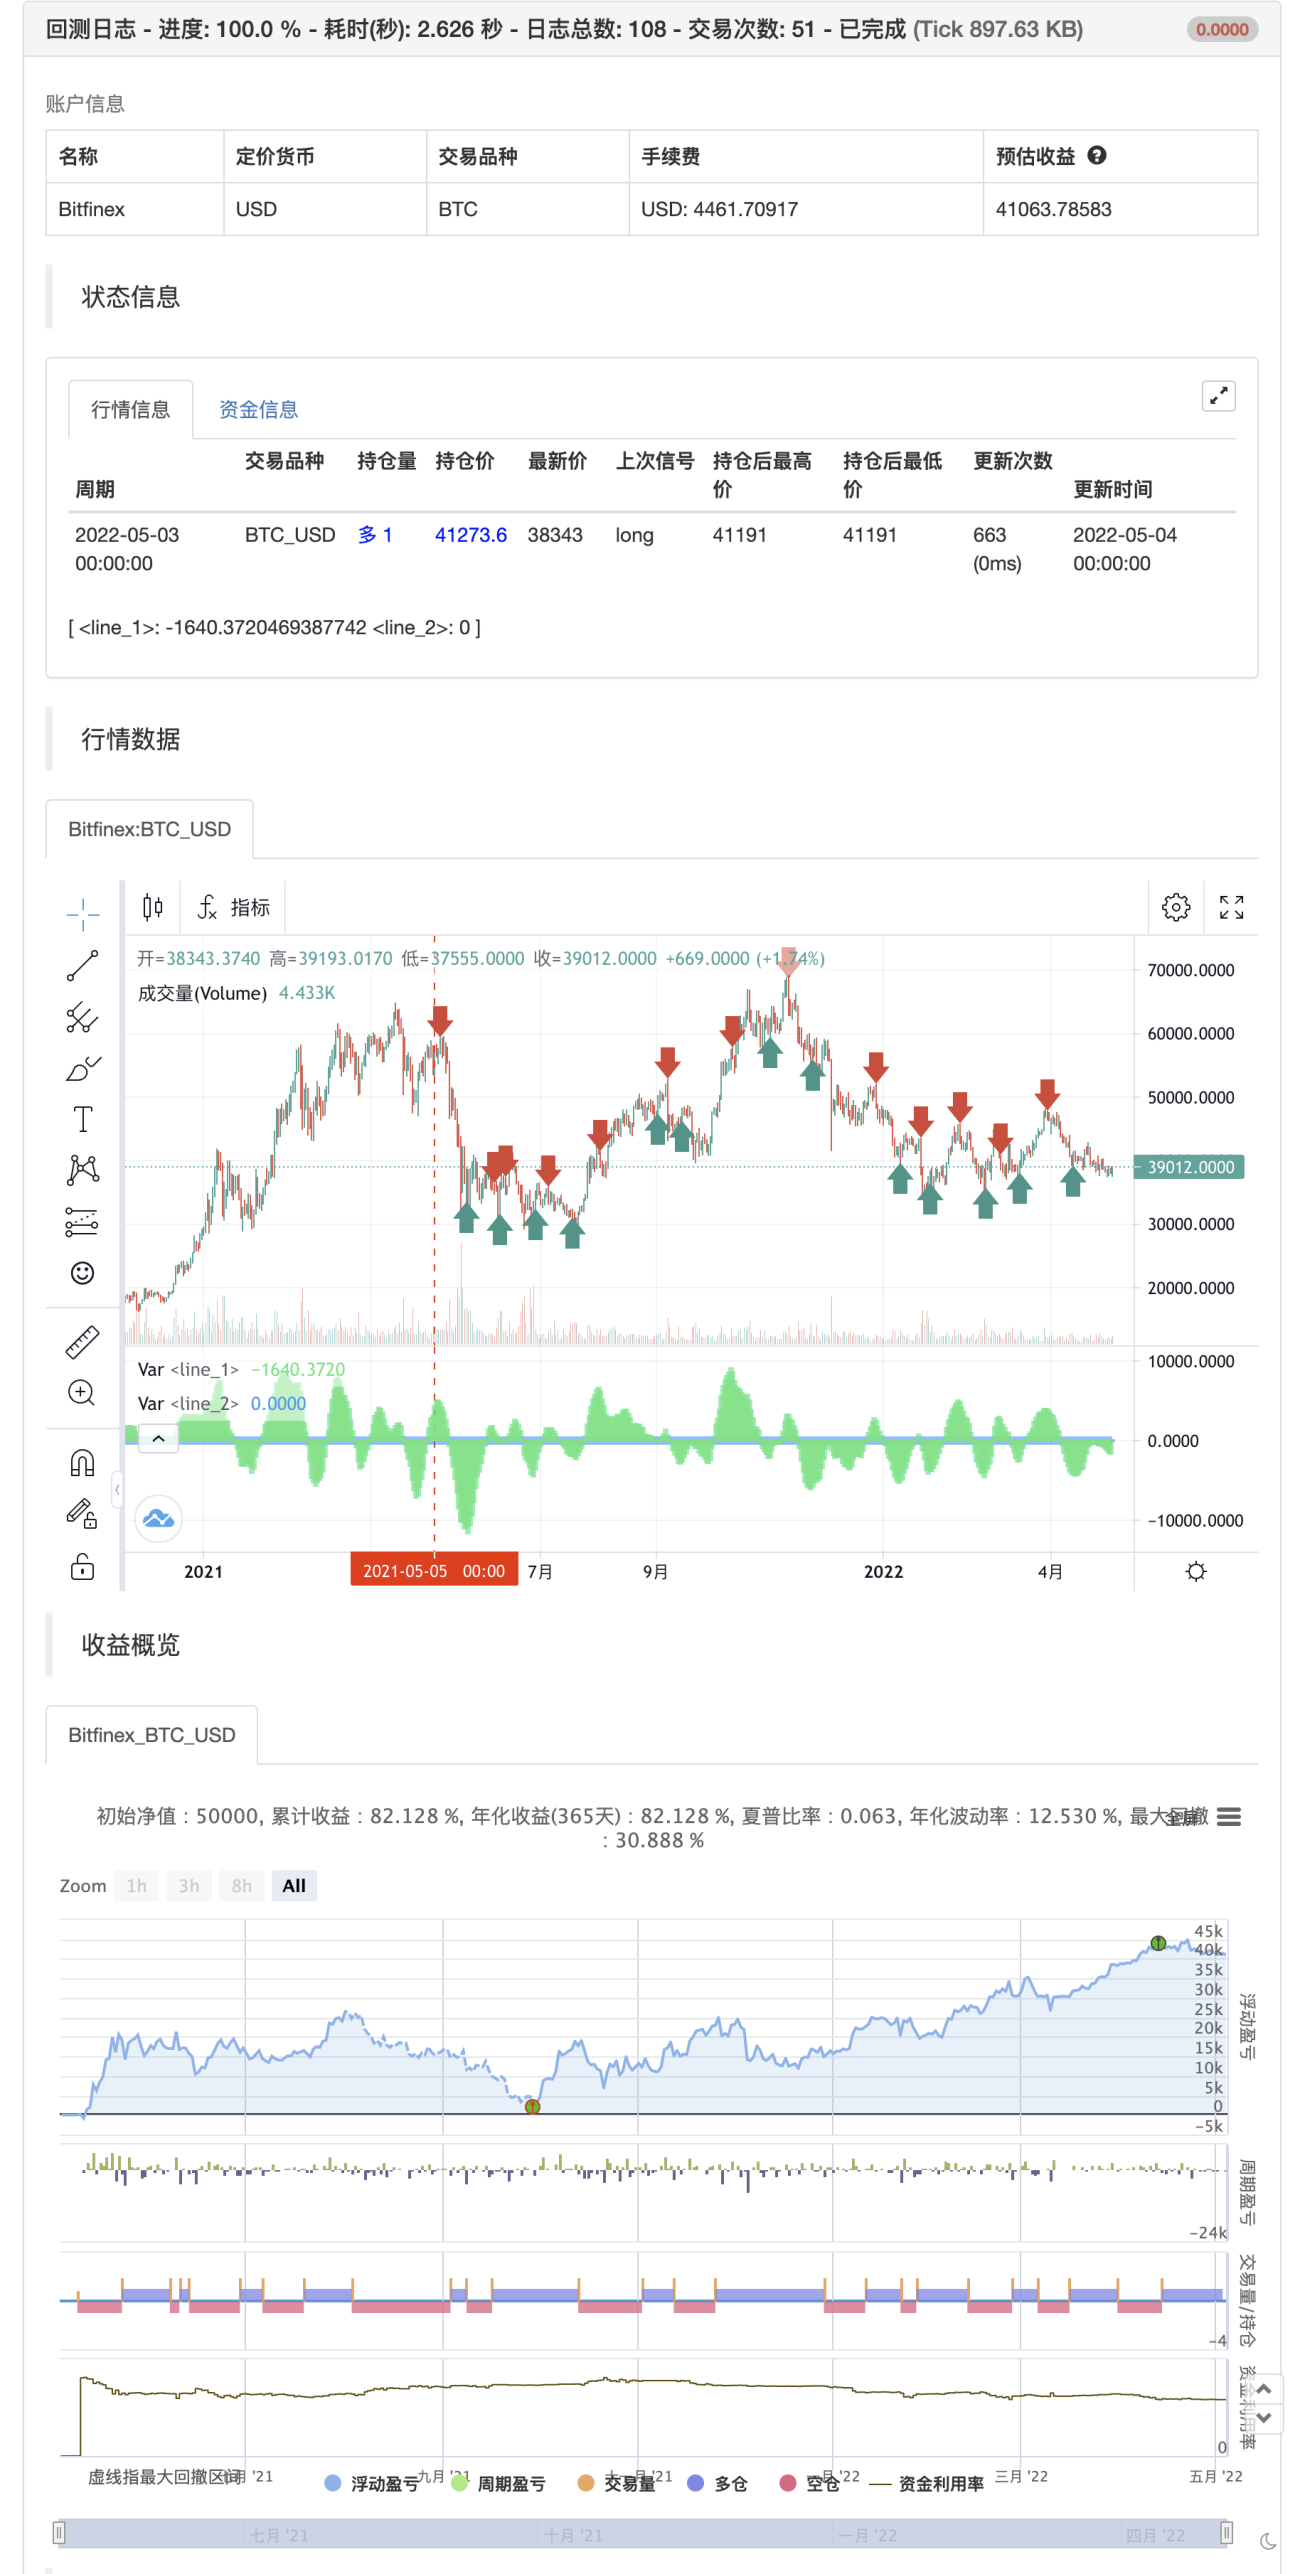
- 1