Indicator: WaveTrend Oscillator

Author: ChaoZhang, Date: 2022-05-06 18:40:27
Tags: EMASMA

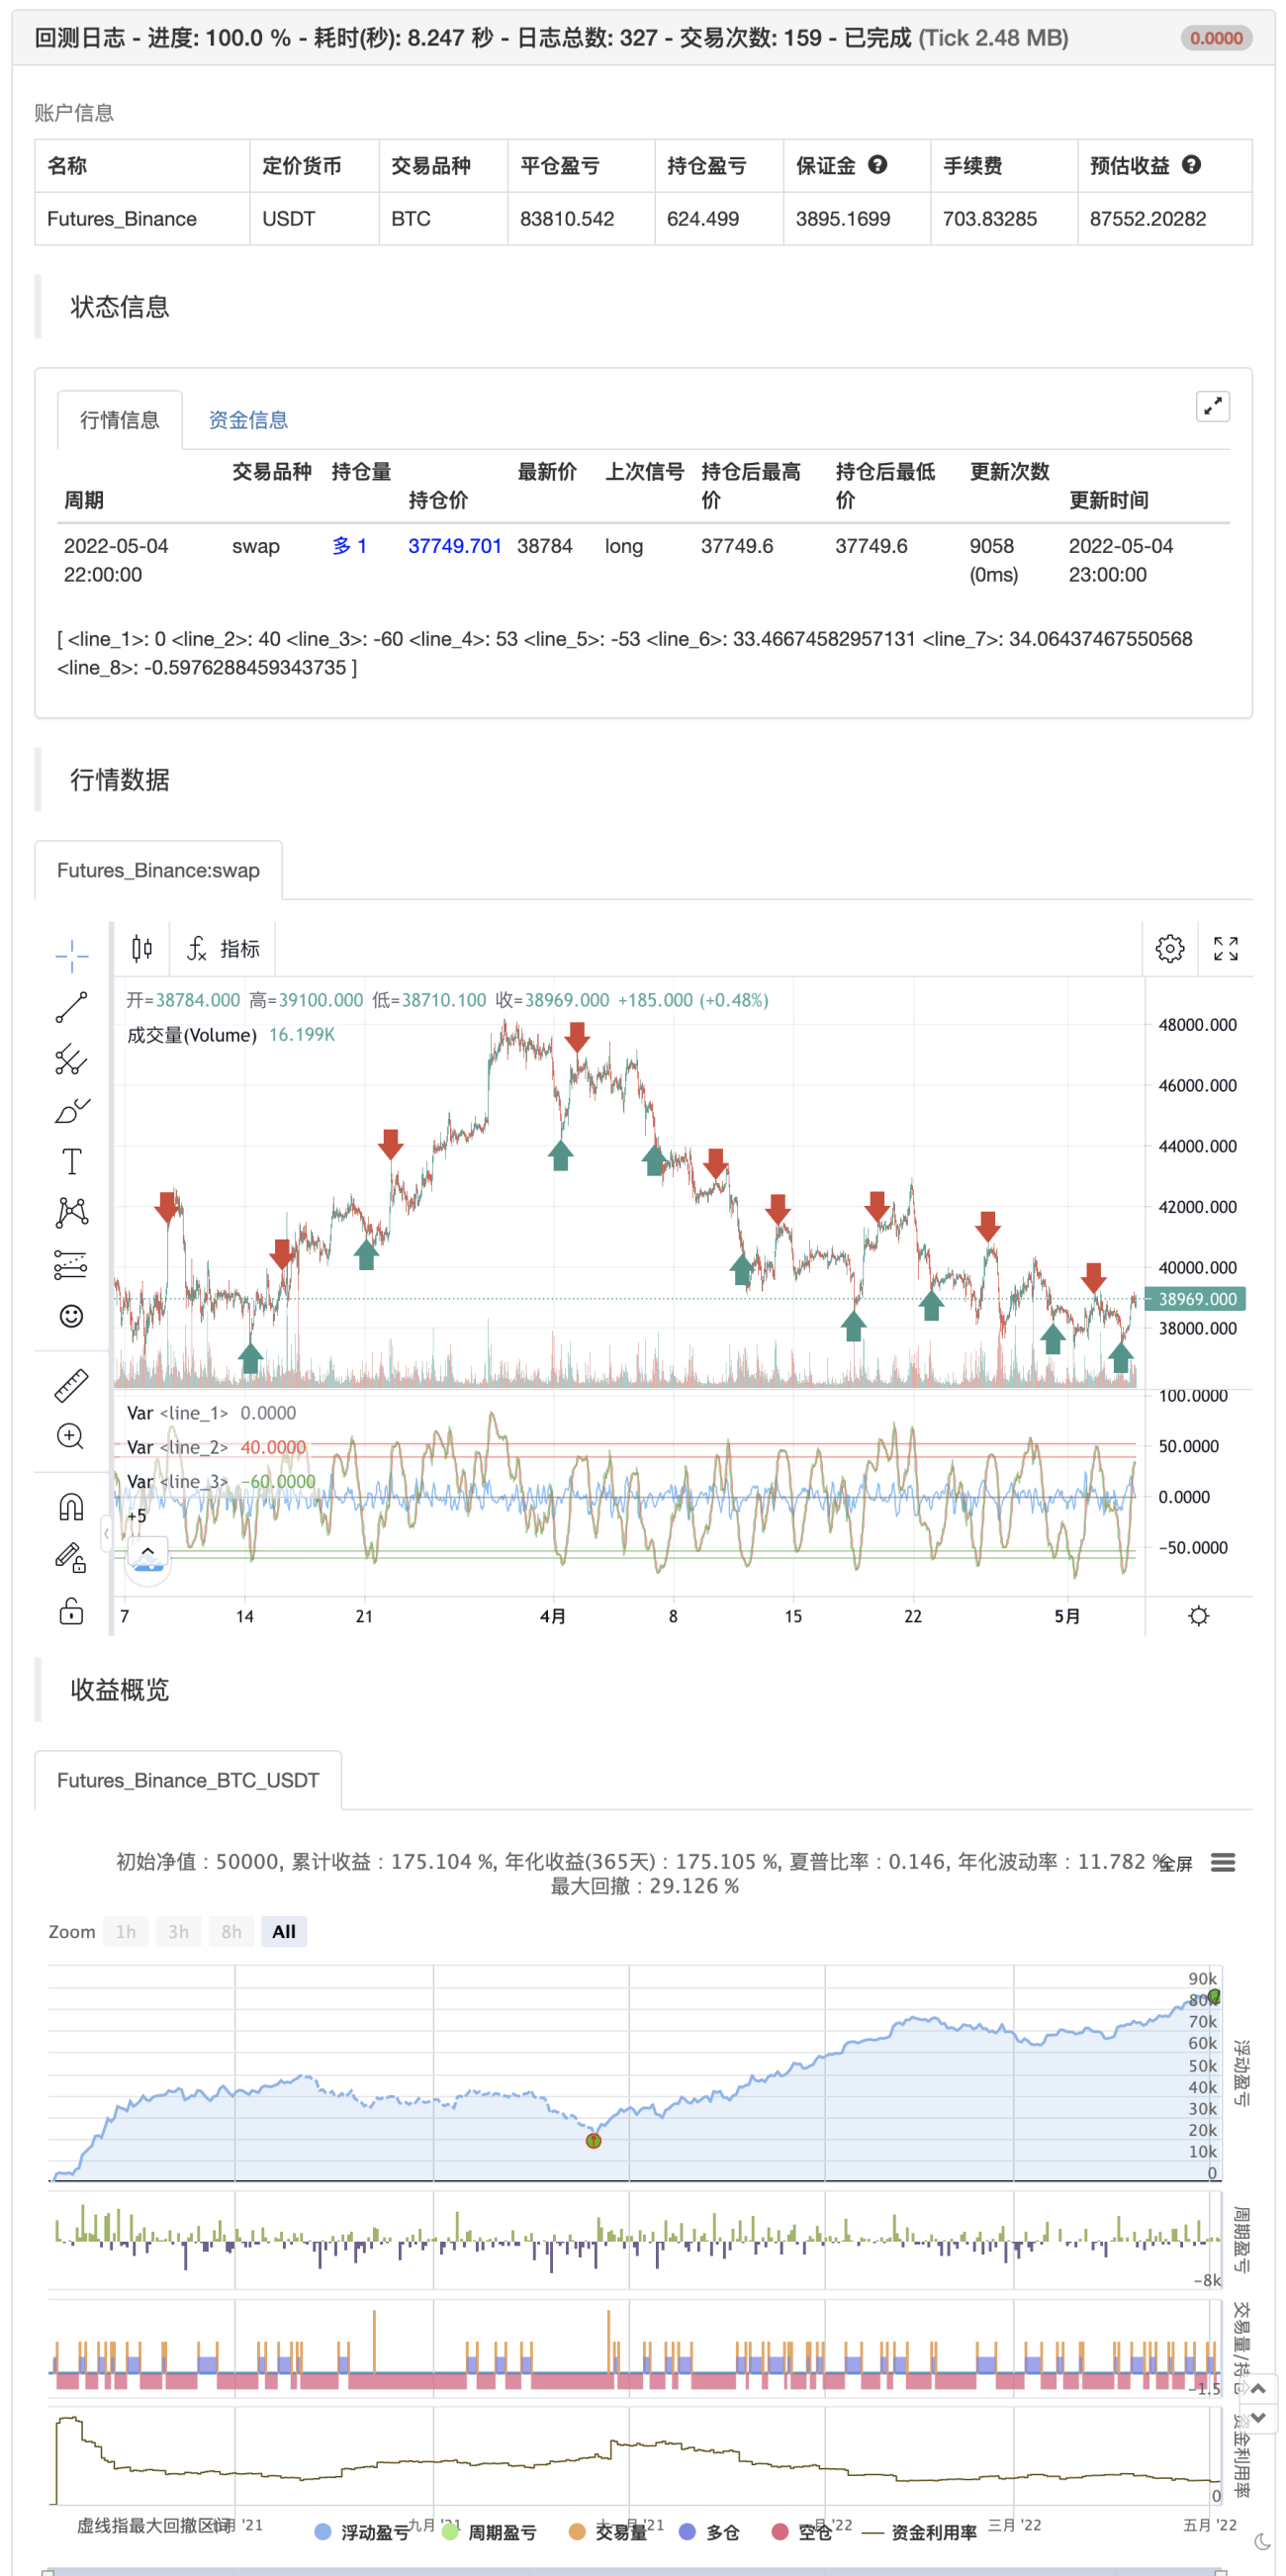
WaveTrend Oscillator is a port of a famous TS /MT indicator. When the oscillator is above the overbought band (red lines) and crosses down the signal (dotted line), it is usually a good SELL signal. Similarly, when the oscillator crosses above the signal when below the Oversold band (green lines), it is a good BUY signal.

I have marked some cross-overs in the above chart. As you can see, they are not the only useful signals WT generates. Try it on your instrument and let me know what you think.

回测 img


/*backtest
start: 2021-05-05 00:00:00
end: 2022-05-04 23:59:00
period: 1h
basePeriod: 15m
exchanges: [{"eid":"Futures_Binance","currency":"BTC_USDT"}]
args: [["v_input_3",40]]
*/

//
// @author LazyBear
//
// If you use this code in its original/modified form, do drop me a note. 
//
study(title="WaveTrend [LazyBear]", shorttitle="WT_LB")
n1 = input(10, "Channel Length")
n2 = input(21, "Average Length")
obLevel1 = input(60, "Over Bought Level 1")
obLevel2 = input(53, "Over Bought Level 2")
osLevel1 = input(-60, "Over Sold Level 1")
osLevel2 = input(-53, "Over Sold Level 2")
 
ap = hlc3 
esa = ta.ema(ap, n1)
d = ta.ema(math.abs(ap - esa), n1)
ci = (ap - esa) / (0.015 * d)
tci = ta.ema(ci, n2)
 
wt1 = tci
wt2 = ta.sma(wt1,4)

plot(0, color=color.gray)
plot(obLevel1, color=color.red)
plot(osLevel1, color=color.green)
plot(obLevel2, color=color.red, style=3)
plot(osLevel2, color=color.green, style=3)

plot(wt1, color=color.green)
plot(wt2, color=color.red, style=3)
plot(wt1-wt2, color=color.blue, transp=80)
if wt1 >obLevel1
    strategy.entry("entry short", strategy.short)
else if wt1 < osLevel1
    strategy.entry("entry long", strategy.long)


Related

More