Swing Highs/Lows & Candle Patterns

This script labels swing highs and swing lows as well as the candle pattern that occurred at that precise point. The script can detect the following 6 candle patterns: hammer , inverse hammer , bullish engulfing , hanging man , shooting star , and bearish engulfing .
The notations HH, HL, LH, and LL you can see on the labels are defined as follows:
HH : Higher high
HL : Higher low
LH : Lower high
LL : Lower low
Setting
Length: Sensitivity of the swing high/low detection, with lower values returning the maximum/minimum of shorter-term price variations.
Usage & Details
It can be interesting to see if a top or bottom is associated with a specific candle pattern, this allows us to study the potential of such a pattern to indicate a reversal. You can hover on a label with a specific pattern to see more details about it.
Note that the labels are offset, and will appear later in real-time, as such this indicator is not intended to detect tops/bottoms in real-time.
Higher values of length might return errors.
backtest
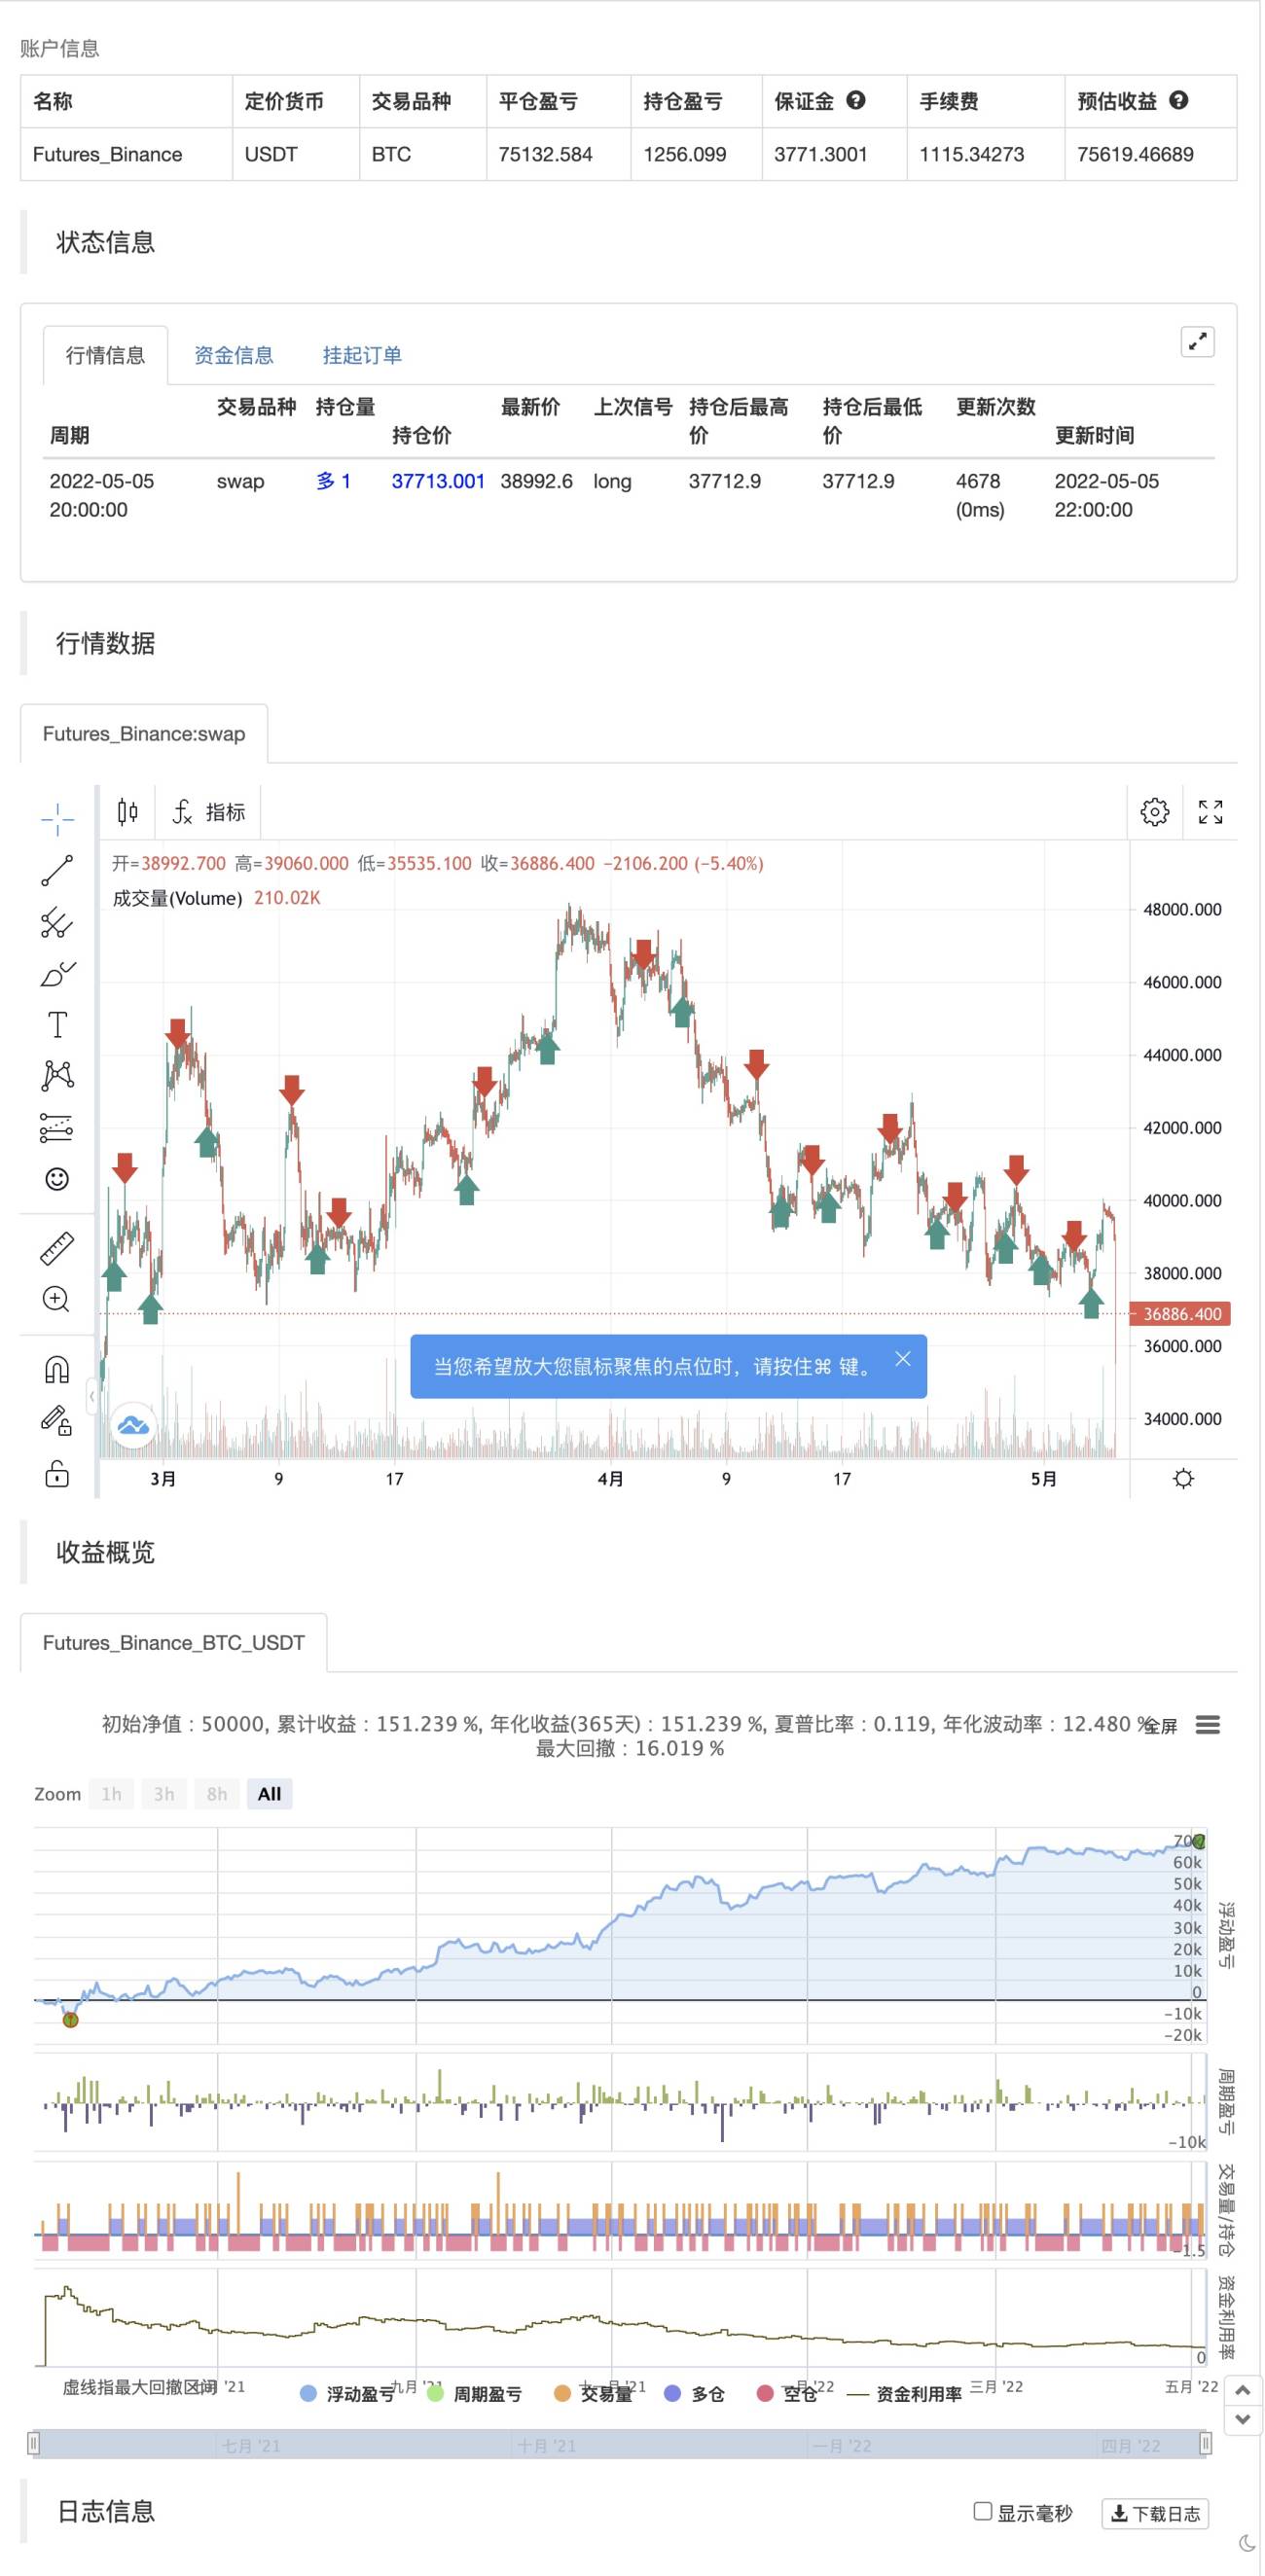
/*backtest
start: 2021-05-06 00:00:00
end: 2022-05-05 23:59:00
period: 2h
basePeriod: 15m
exchanges: [{"eid":"Futures_Binance","currency":"BTC_USDT"}]
*/

// This work is licensed under a Attribution-NonCommercial-ShareAlike 4.0 International (CC BY-NC-SA 4.0) https://creativecommons.org/licenses/by-nc-sa/4.0/
// © LuxAlgo

//@version=4- 1