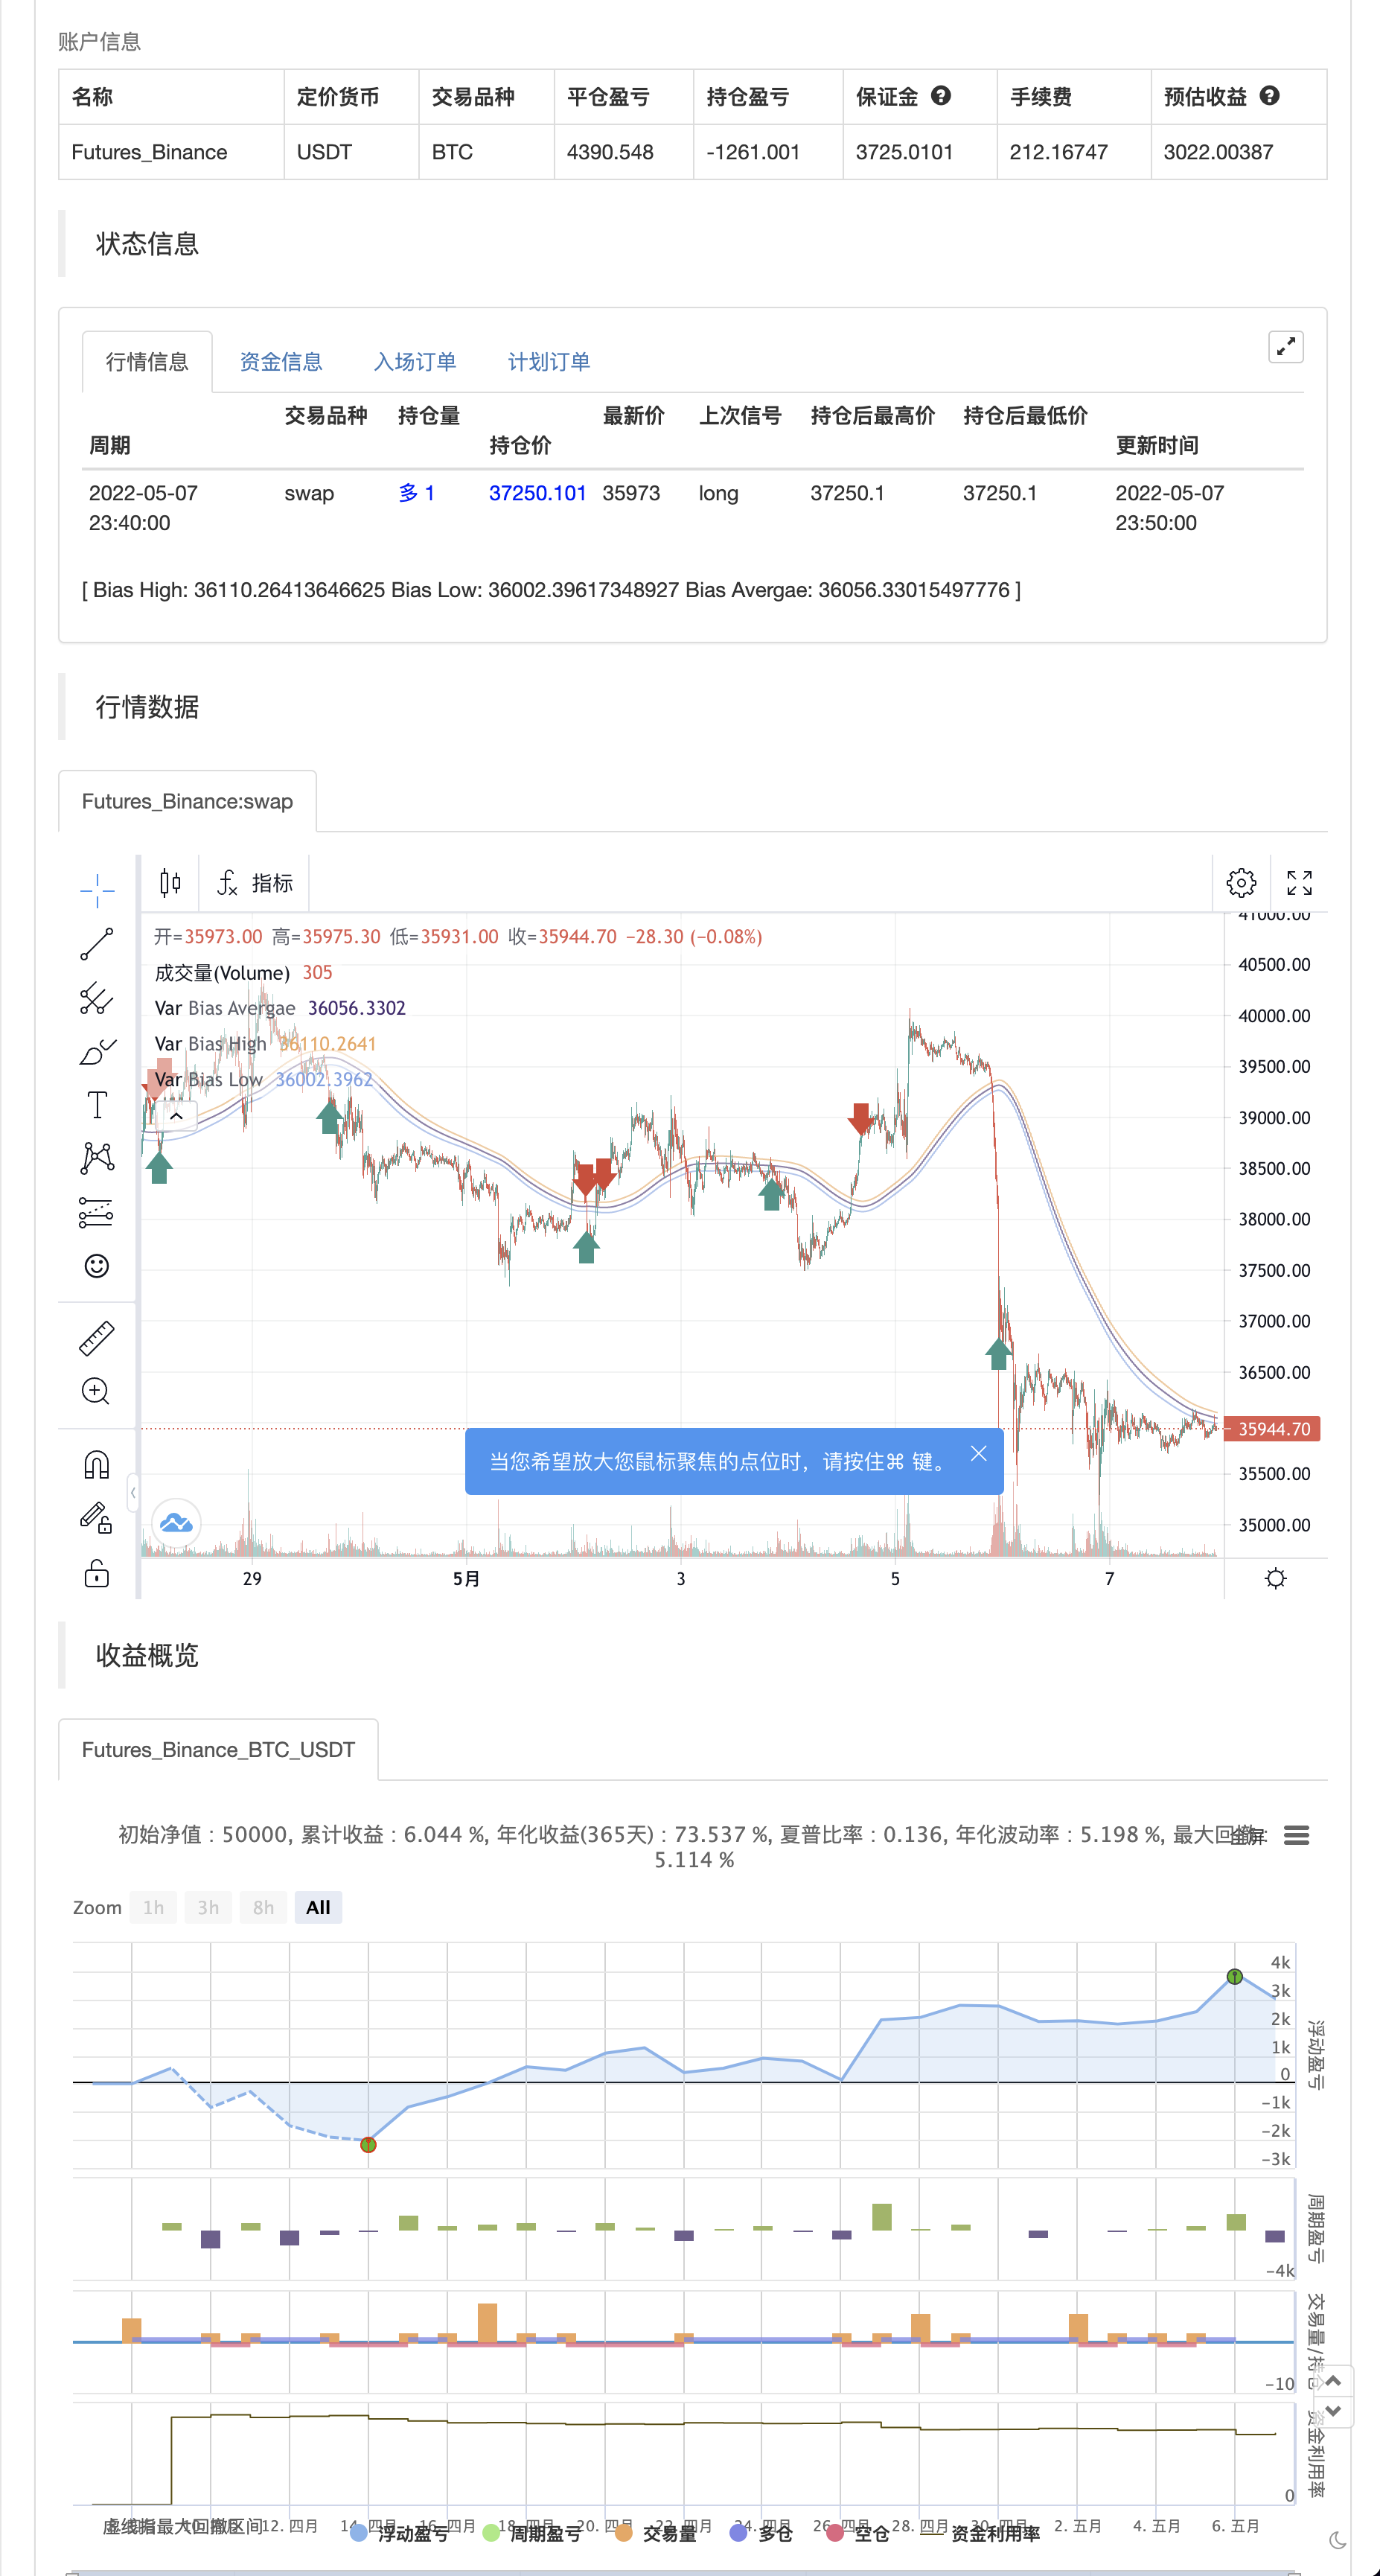
Hello Everyone. I hope you are all doing great. It’s been a long time since I posted my first script here, and I got a lot of response from that.
So, I thought I should share this script also to everyone, and anyone that may find it useful. Personally, I use it to tell the general market conditions.
Here’s how I works : The script tries to determine the overall direction of the market, using smoothed Heiken Ashi candles. The coloring system (using bright and dark colors) is an attempt to detect strong market and weak market conditions. There’s also an oscillator within the script, but for now it isn’t plotted. Credits to @jackvmk, I used part of his open-script code in this indicator.
I have considered using the slope of the indicator plot as a filter for ranging market conditions. The plot goes relatively flat in ‘flat’ markets. However, I have not done anything about that yet. Maybe some other time.
I hope you find this useful. If you find a way to use this, please share it with the community in the comment section.
NOTE: THIS IS BY NO MEANS FINANCIAL ADVICE. You’ll have to make your studies and come up with a way to apply this indicator to your trading style and strategy.
By the way, I would be going with the name ‘CEREBR’ for any subsequent scripts I release from now on.
backtest

/*backtest
start: 2022-04-08 00:00:00
end: 2022-05-07 23:59:00
period: 10m
basePeriod: 1m
exchanges: [{"eid":"Futures_Binance","currency":"BTC_USDT"}]
*/

// This source code is subject to the terms of the Mozilla Public License 2.0 at https://mozilla.org/MPL/2.0/
// © Professeur_X

//@version=5

indicator(title='HA Market Bias', shorttitle='HA Market Bias', overlay=true)

tf(_res, _exp, gaps_on) =>
    gaps_on == 0 ? request.security(syminfo.tickerid, _res, _exp) : gaps_on == true ? request.security(syminfo.tickerid, _res, _exp, barmerge.gaps_on, barmerge.lookahead_off) : request.security(syminfo.tickerid, _res, _exp, barmerge.gaps_off, barmerge.lookahead_off)

ha_htf = ''
show_ha = input.bool(true, "Show HA Plot/ Market Bias", group="HA Market Bias")
ha_len = input(100, 'Period', group="HA Market Bias")
ha_len2 = input(100, 'Smoothing', group="HA Market Bias")

// Calculations {
o = ta.ema(open, ha_len)
c = ta.ema(close, ha_len)
h = ta.ema(high, ha_len)
l = ta.ema(low, ha_len)

haclose = tf(ha_htf, (o + h + l + c) / 4, 0)
xhaopen = tf(ha_htf, (o + c) / 2, 0)
haopen = na(xhaopen[1]) ? (o + c) / 2 : (xhaopen[1] + haclose[1]) / 2
hahigh = math.max(h, math.max(haopen, haclose))
halow = math.min(l, math.min(haopen, haclose))


o2 = tf(ha_htf, ta.ema(haopen, ha_len2), 0)
c2 = tf(ha_htf, ta.ema(haclose, ha_len2), 0)
h2 = tf(ha_htf, ta.ema(hahigh, ha_len2), 0)
l2 = tf(ha_htf, ta.ema(halow, ha_len2), 0)

ha_avg = (h2 + l2) / 2
// }

// Oscillator {
osc_len = input.int(7, "Oscillator Period", group="HA Market Bias")

osc_bias = 100 *(c2 - o2)
osc_smooth = ta.ema(osc_bias, osc_len)

sigcolor =
  (osc_bias > 0) and (osc_bias >= osc_smooth) ? color.new(color.lime, 35) :
  (osc_bias > 0) and (osc_bias < osc_smooth) ? color.new(color.lime, 75) :
  (osc_bias < 0) and (osc_bias <= osc_smooth) ? color.new(color.red, 35) :
  (osc_bias < 0) and (osc_bias > osc_smooth) ? color.new(color.red, 75) :
  na
// }

// Plots {
p_h = plot(h2, "Bias High", display=display.none, editable=false)
p_l = plot(l2, "Bias Low", display=display.none, editable=false)
p_avg = plot(ha_avg, "Bias Avergae", display=display.none, editable=false)


col = o2 > c2 ? color.red : color.lime

if o2 > c2
    strategy.entry("Enter Long", strategy.long)
else if o2 < c2
    strategy.entry("Enter Short", strategy.short)