Best TradingView Strategy

Author: ChaoZhang, Date: 2022-05-09 21:08:17
Tags: RSIMA

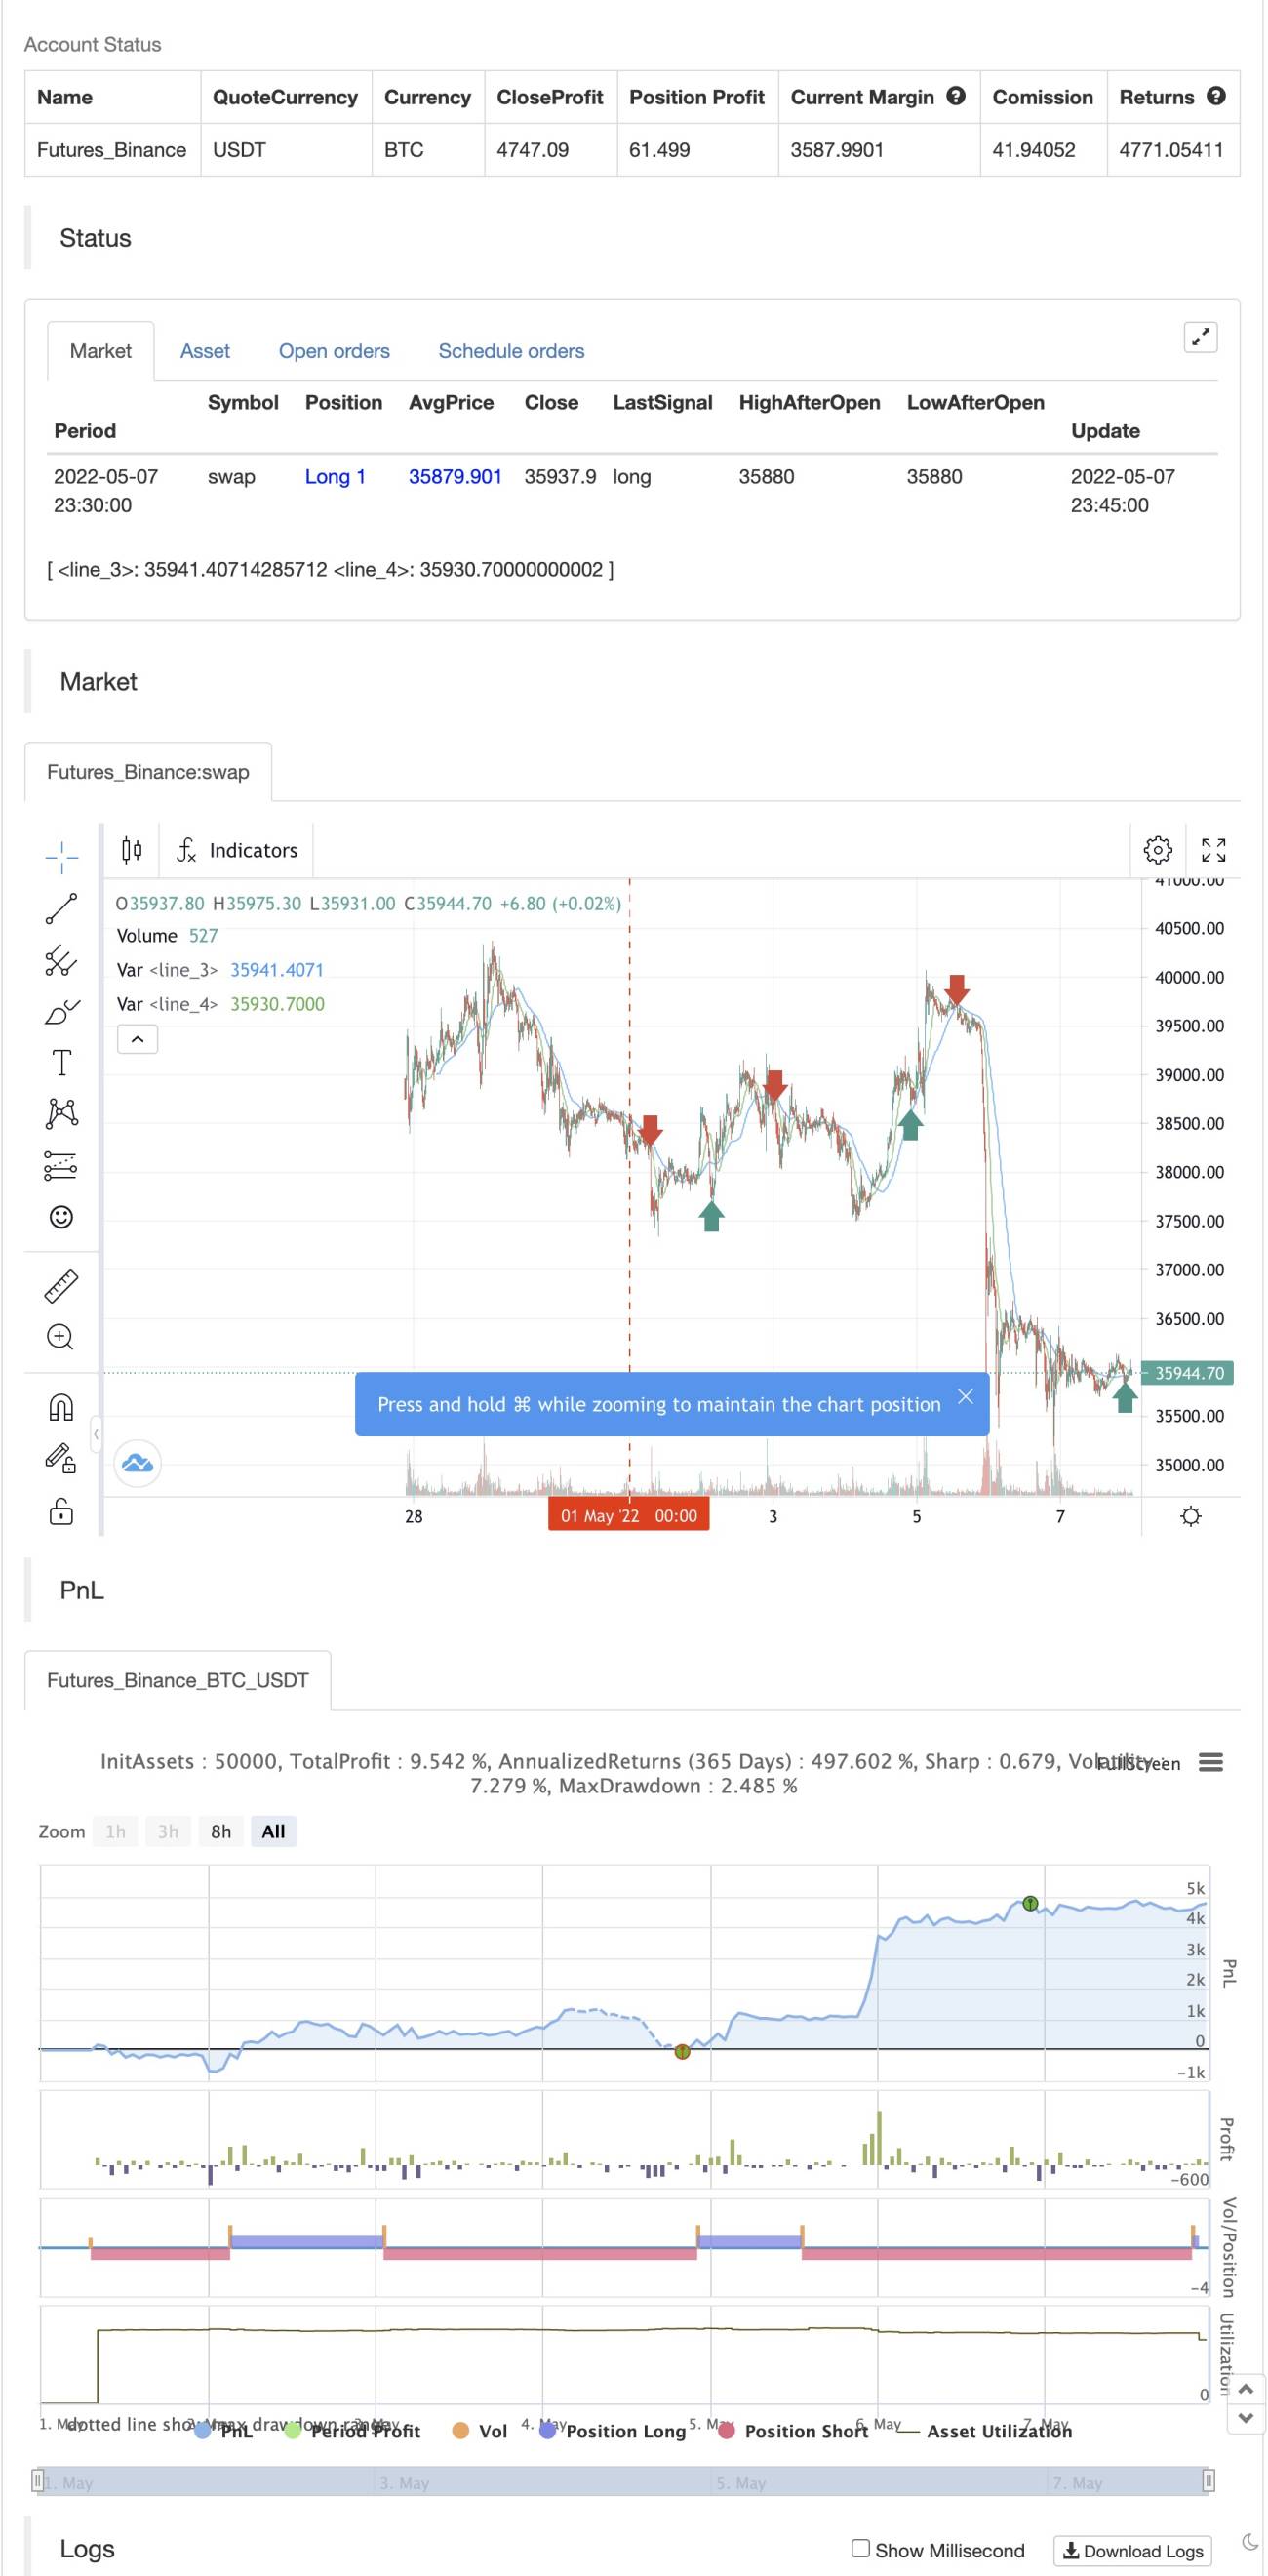
The script is totally based on momentum , volume and price. We have used : 1: Bollinger Band Squeezes to know when a breakout might happen. 2: Used Moving Averages( SMA and EMA ) to know the direction. 3: The success Rate of this strategy is above 75% and if little price action is added it can easily surpass 90% success mark. 4: Do not worry about drawdowns , we have implemented trailing SL ,so you might see a little extra drawdown but in reality its pretty less. 5: I myself have tested this strategy for 41 days with a 250$ account and right now I have 2700$.

backtest

img


/*backtest
start: 2022-05-01 00:00:00
end: 2022-05-07 23:59:00
period: 15m
basePeriod: 5m
exchanges: [{"eid":"Bitfinex","currency":"BTC_USD"}]
*/

// This source code is subject to the terms of the Mozilla Public License 2.0 at https://mozilla.org/MPL/2.0/
// © The_Bigger_Bull
//@version=5
strategy("Best TradingView Strategy", overlay=true, margin_long=0, margin_short=0)
//Bollinger Bands
source1 = close
length1 = input.int(15, minval=1)
mult1 = input.float(2.0, minval=0.001, maxval=50)
basis1 = ta.sma(source1, length1)
dev1 = mult1 * ta.stdev(source1, length1)
upper1 = basis1 + dev1
lower1 = basis1 - dev1
//buyEntry = ta.crossover(source1, lower1)
//sellEntry = ta.crossunder(source1, upper1)

//RSI
ma(source, length, type) =>
    switch type
        "SMA" => ta.sma(source, length)
        "Bollinger Bands" => ta.sma(source, length)
        "EMA" => ta.ema(source, length)
        "SMMA (RMA)" => ta.rma(source, length)
        "WMA" => ta.wma(source, length)
        "VWMA" => ta.vwma(source, length)

rsiLengthInput = input.int(14, minval=1, title="RSI Length", group="RSI Settings")
rsiSourceInput = input.source(close, "Source", group="RSI Settings")
maTypeInput = input.string("SMA", title="MA Type", options=["SMA", "Bollinger Bands", "EMA", "SMMA (RMA)", "WMA", "VWMA"], group="MA Settings")
maLengthInput = input.int(14, title="MA Length", group="MA Settings")
bbMultInput = input.float(2.0, minval=0.001, maxval=50, title="BB StdDev", group="MA Settings")

up = ta.rma(math.max(ta.change(rsiSourceInput), 0), rsiLengthInput)
down = ta.rma(-math.min(ta.change(rsiSourceInput), 0), rsiLengthInput)
rsi = down == 0 ? 100 : up == 0 ? 0 : 100 - (100 / (1 + up / down))
rsiMA = ma(rsi, maLengthInput, maTypeInput)
isBB = maTypeInput == "Bollinger Bands"

//plot(rsi, "RSI", color=#7E57C2)
//plot(rsiMA, "RSI-based MA", color=color.yellow)
rsiUpperBand = hline(70, "RSI Upper Band", color=#787B86)
hline(50, "RSI Middle Band", color=color.new(#787B86, 50))
rsiLowerBand = hline(30, "RSI Lower Band", color=#787B86)
//fill(rsiUpperBand, rsiLowerBand, color=color.rgb(126, 87, 194, 90), title="RSI Background Fill")
bbUpperBand = plot(isBB ? rsiMA + ta.stdev(rsi, maLengthInput) * bbMultInput : na, title = "Upper Bollinger Band", color=color.green)
bbLowerBand = plot(isBB ? rsiMA - ta.stdev(rsi, maLengthInput) * bbMultInput : na, title = "Lower Bollinger Band", color=color.green)
//fill(bbUpperBand, bbLowerBand, color= isBB ? color.new(color.green, 90) : na, title="Bollinger Bands Background Fill")

//ADX

adxlen = input(14, title="ADX Smoothing")
dilen = input(14, title="DI Length")
dirmov(len) =>
	up1 = ta.change(high)
	down1 = -ta.change(low)
	plusDM = na(up1) ? na : (up1 > down1 and up1 > 0 ? up1 : 0)
	minusDM = na(down1) ? na : (down1 > up1 and down1 > 0 ? down1 : 0)
	truerange = ta.rma(ta.tr, len)
	plus = fixnan(100 * ta.rma(plusDM, len) / truerange)
	minus = fixnan(100 * ta.rma(minusDM, len) / truerange)
	[plus, minus]
adx(dilen, adxlen) =>
	[plus, minus] = dirmov(dilen)
	sum = plus + minus
	adx = 100 * ta.rma(math.abs(plus - minus) / (sum == 0 ? 1 : sum), adxlen)
sig = adx(dilen, adxlen)


out = ta.sma(close, 14)

sma1=ta.sma(close,42)

ema200=ta.ema(close,200)


longCondition = (out>sma1) and ta.crossover(source1, lower1) 

if (longCondition )
    strategy.entry("long", strategy.long)
    
shortCondition = (out<sma1) and ta.crossunder(source1, lower1) 

if (shortCondition )
    strategy.entry("short", strategy.short)
    
    
stopl=strategy.position_avg_price-50
tptgt=strategy.position_avg_price+100
stopshort=strategy.position_avg_price+50
tptgtshort=strategy.position_avg_price-100

strategy.exit("longclose","long",trail_offset=50,trail_points=100,when=ta.crossover(sma1,out))
strategy.exit("shortclose","short",trail_offset=50,trail_points=100,when=ta.crossover(out,sma1))

    
//if strategy.position_avg_price<0
    
    
plot(sma1 , color=color.blue)
plot(out, color=color.green)
//plot(ema200,color=color.red)


Related

More