Hull-4ema

Author: ChaoZhang, Date: 2022-05-10 23:47:44
Tags: EMASMA

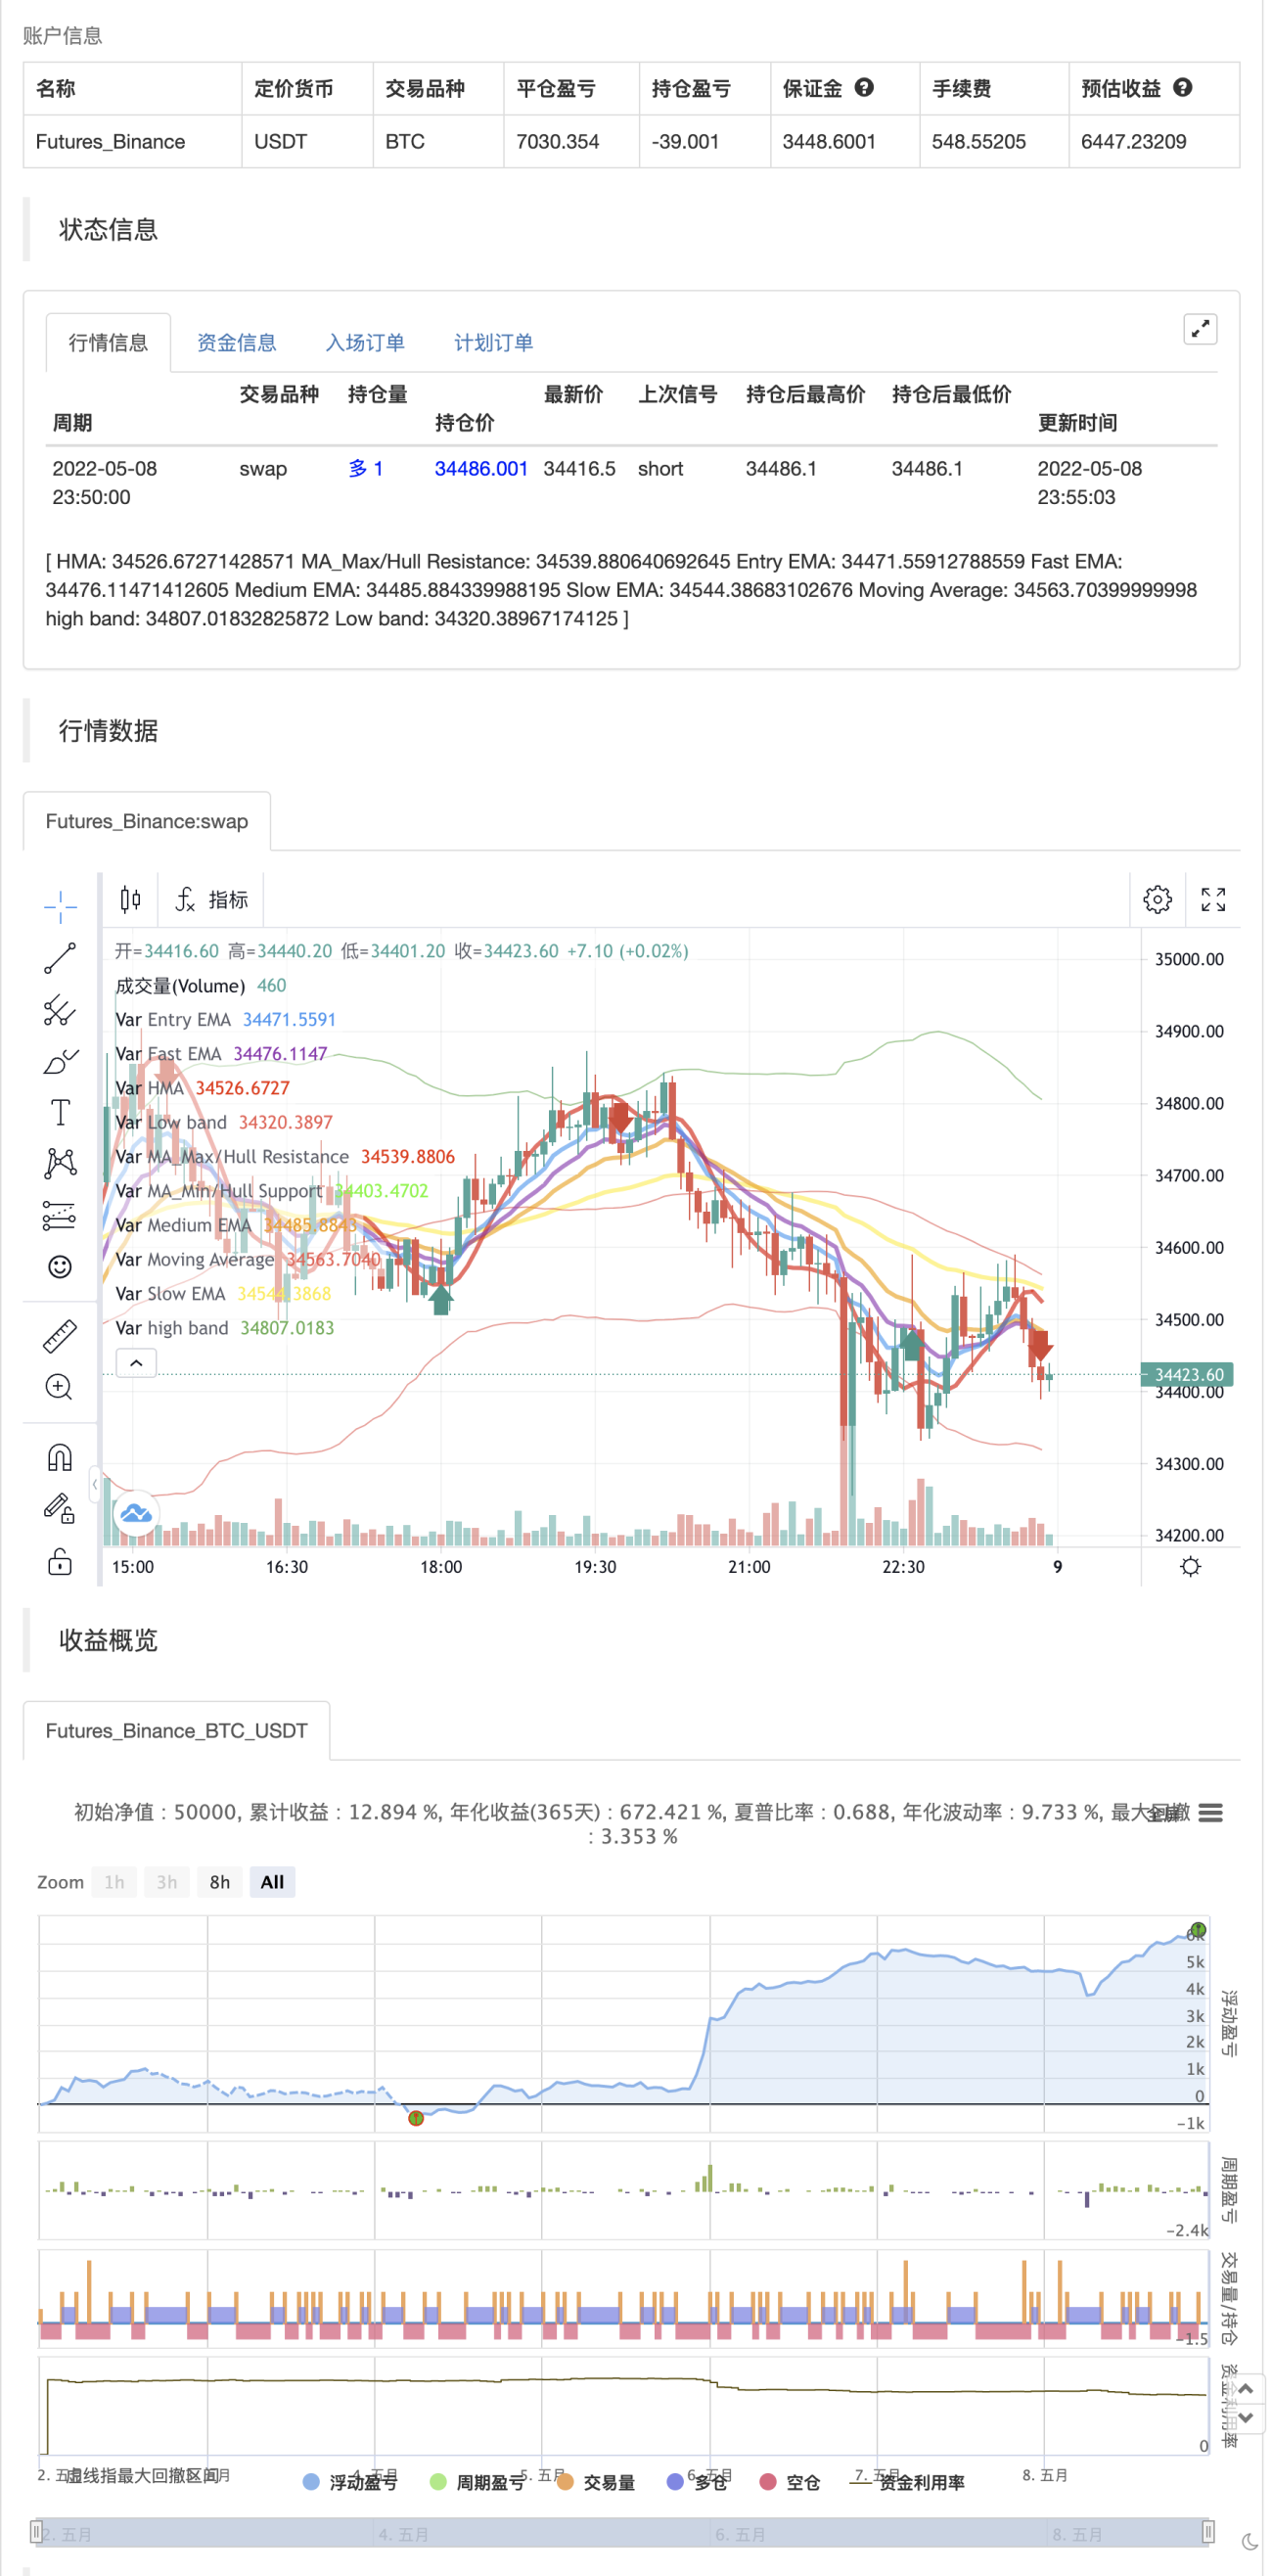
this is a test just trying out pine script 4EMA indicator has been created for everyone.

backtest

img


/*backtest
start: 2022-05-02 00:00:00
end: 2022-05-08 23:59:00
period: 5m
basePeriod: 1m
exchanges: [{"eid":"Futures_Binance","currency":"BTC_USDT"}]
*/

//@version=4

                                            
//                                           


study("Hull-4ema", overlay=true)

// ————— Inputs
price = input(hl2, title="Source")

//for charting the indicator on higher aggregation periods eg. hourly hull on 15 min chart
//comment out the price variable above, and uncomment code below
//note: syminfo.tickerid doesn't work when you are charting a ratio of different tickers eg. ETH/BTC*100

//res = input(title="Resolution",type=input.resolution,defval="60")
//src = input(hl2, title="Source")
//price = security(syminfo.tickerid,res,src)

HMA_Length = input(21, "HMA Length", type=input.integer)
lookback = input(2, "lookback", type=input.integer)
ShowHullSupResLines = input(false, "ShowHullSup/ResLines", type=input.bool)
ShowBuySellArrows = input(false, "ShowBuySellArrows", type=input.bool)
ShowDivergenceLabel = input(false, "ShowDivergenceLabel", type=input.bool)
ExtendSupResLines = input(false, "ExtendLocalSup/ResLines", type=input.bool)

// ————— Calculations
HMA = hma(price, HMA_Length)

delta = HMA[1] - HMA[lookback + 1]
delta_per_bar = delta/lookback

next_bar = HMA[1] + delta_per_bar

concavity = HMA > next_bar ? 1 : -1

//turningpoint = concavity[1] != concavity ? HMA[1] : na
//plot(turningpoint, "turningpoint", color=color.white, linewidth=1, style=plot.style_circles, offset=-1)

O_R = HMA > HMA[1] ? '#ff7f00' : '#ff0000'
DG_G = HMA < HMA[1] ? '#025f02' : '#00fa03'

// ————— Plots
plot(HMA, "HMA", color=concavity != -1 ? DG_G : O_R, linewidth=3)

//MA_Min and MA_Max Points only
MA_Min = HMA > HMA[1] and HMA[1] < HMA[2] ? HMA[1] : na
MA_Max = HMA < HMA[1] and HMA[1] > HMA[2] ? HMA[1] : na

//MA_Min and MA_Max Series
saveMA_Min = valuewhen(HMA > HMA[1] and HMA[1] < HMA[2], HMA[1], 0)
saveMA_Max = valuewhen(HMA < HMA[1] and HMA[1] > HMA[2], HMA[1], 0)

//Draw MA_Min/MA_Max as lines from series or just points
plot(ShowHullSupResLines ? saveMA_Min : MA_Min, "MA_Min/Hull Support", style = plot.style_circles, color = #00fa03, linewidth=1, trackprice=ExtendSupResLines, offset=-1)
plot(ShowHullSupResLines ? saveMA_Max : MA_Max, "MA_Max/Hull Resistance", style = plot.style_circles, color = #ff0000, linewidth=1, trackprice=ExtendSupResLines, offset=-1)

//Draw Arrows at MA_Min/MA_Max
plotshape(ShowBuySellArrows ? MA_Min : na, "Buy", shape.triangleup, location.belowbar, color.green, text="Buy", offset=-1)
plotshape(ShowBuySellArrows ? MA_Max : na, "Sell", shape.triangledown, location.abovebar, color.red, text="Sell", offset=-1)

//Divergence Label
divergence = round(HMA-next_bar, precision=4)
divergenceColor = if concavity<0 and divergence[1] > divergence
    color.red
else if concavity<0 and divergence[1] < divergence
    color.fuchsia
else if concavity>0 and divergence[1] < divergence
    color.green
else
    color.yellow

labelText = "Divergence:\n" + str.tostring(divergence)
divergenceLabel = ShowDivergenceLabel ? label.new(x=bar_index,y=close,text=labelText,yloc=yloc.belowbar,color=divergenceColor,textcolor=color.black,style=label.style_label_up,size=size.normal) : na

//label.delete(divergenceLabel[1])

// ————— Alerts
alertcondition(crossover(HMA,saveMA_Min), title="Buy Signal",message="Hull Crossing above MA_Min, Bullish")
alertcondition(crossunder(HMA,saveMA_Max), title="Sell Signal",message="Hull Crossing below MA_Max, Bearish")

if crossover(HMA,saveMA_Min)
    strategy.entry("Enter Long", strategy.long)
else if crossunder(HMA,saveMA_Max)
    strategy.entry("Enter Short", strategy.short)

//


//@version=4

//study(title="4 EMA", shorttitle="4EMA", overlay=true)

len1 = input(8, minval=8, title="Length")
len2 = input(13, minval=8, title="Length")
len3 = input(21,minval=8, title="Length")
len4 = input(55, minval=8, title="Length")

src = input(close, title="Source")

entryema = ema(src, len1)
fastema = ema(src, len2)
mediumema = ema(src, len3)
slowema = ema(src, len4)

plot(entryema, color=color.blue, linewidth=3, title="Entry EMA")
plot(fastema, color=color.purple, linewidth=3, title="Fast EMA")
plot(mediumema, color=color.orange, linewidth=3, title="Medium EMA")
plot(slowema, color=color.yellow, linewidth=3, title="Slow EMA")

//


//study(shorttitle="BB color V1.1", title="Bollinger Bands color V1.1", overlay=true)

length = input(defval=50, minval=1, title ="MA - Simple")
src1 = input(defval=close, title="Source")
len = input(defval=2, minval=1, title="MA - Exponantial")
mult = input(defval=2.0, minval=0.001, maxval=50)
//pr = input(defval=true, type=bool, title="Price Color" )

//Bollinger Bands
basis = sma(src, length)
dev = mult * stdev(src, length)
upper = basis + dev
lower = basis - dev

price1 = ema(src, len)
linecolor = price >= basis ? color.green : color.red


//Affichage

plot(basis, color=color.red, transp=75, title="Moving Average")
p1 = plot(upper,color=color.green, transp=35, title="high band")
p2 = plot(lower, color=color.red, transp=35, title="Low band")
fill(p1, p2, transp=95, title="background")


Related

More