Combo 2/20 EMA & Bandpass Filter

1
Follow
1789
Followers
This is combo strategies for get a cumulative signal.
First strategy
This indicator plots 2/20 exponential moving average . For the Mov
Avg X 2/20 Indicator, the EMA bar will be painted when the Alert criteria is met.
Second strategy
The related article is copyrighted material from
Stocks & Commodities Mar 2010
WARNING:
- For purpose educate only
- This script to change bars colors.
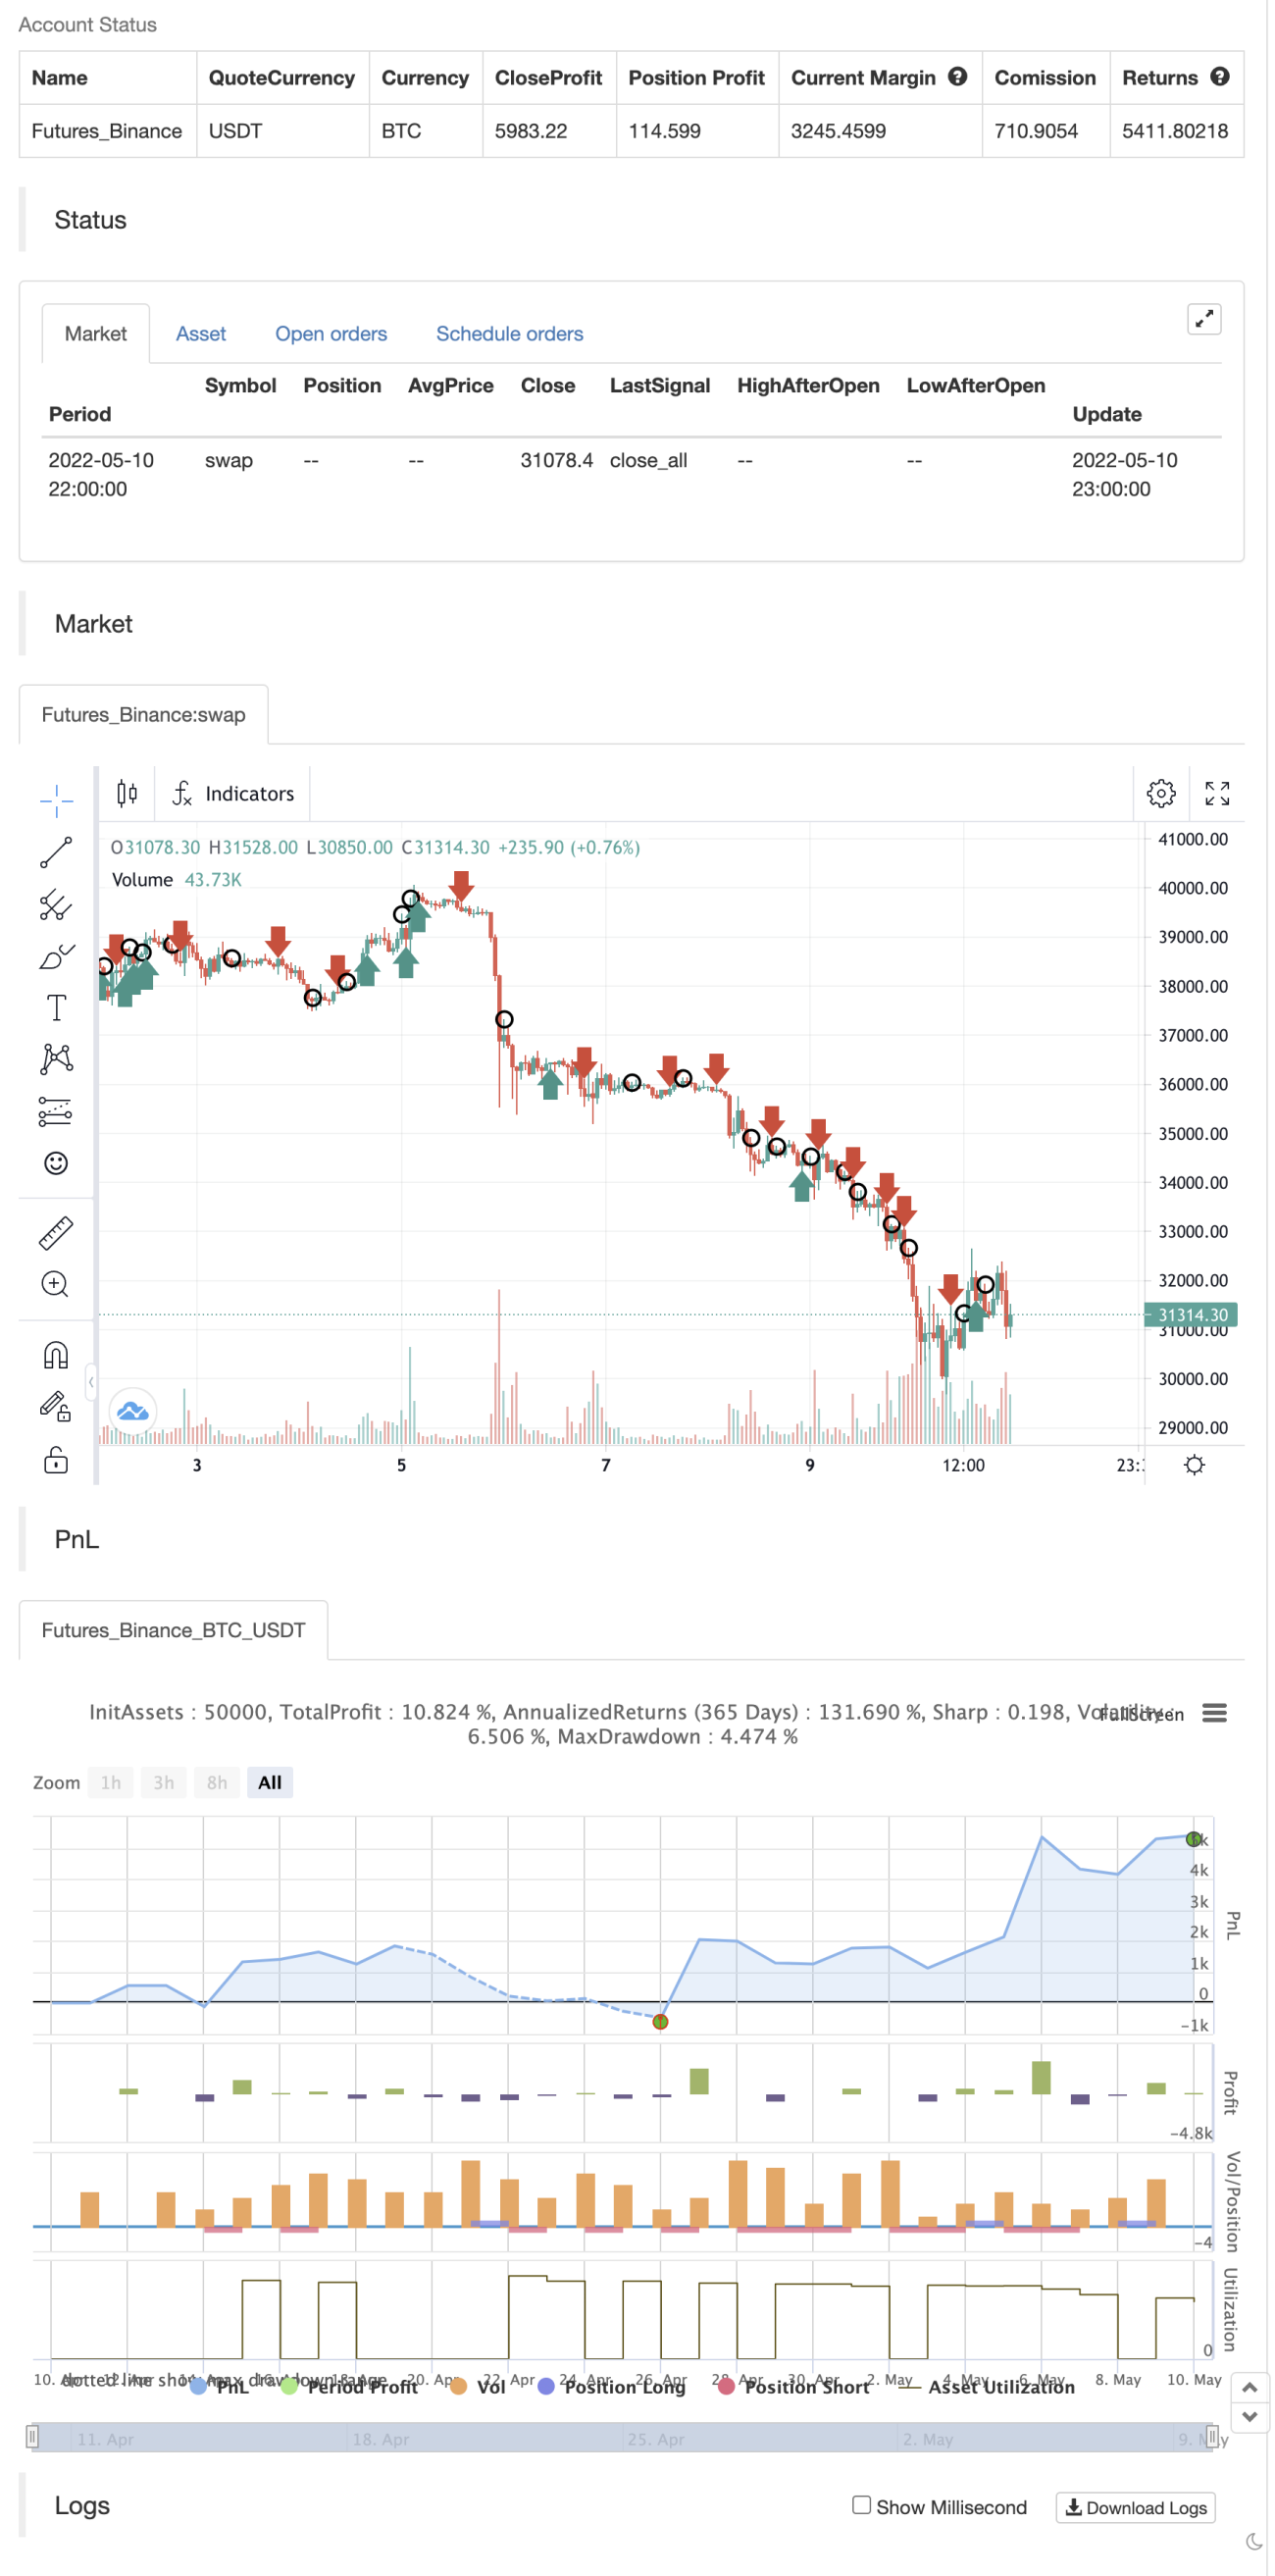
backtest
Source
Pine
//@version=5
////////////////////////////////////////////////////////////
//  Copyright by HPotter v1.0 05/04/2022
// This is combo strategies for get a cumulative signal.
//
// First strategy
// This indicator plots 2/20 exponential moving average. For the Mov
// Avg X 2/20 Indicator, the EMA bar will be painted when the Alert criteria is met.
//
// Second strategy
// The related article is copyrighted material from
// Stocks & Commodities Mar 2010Strategy parameters
Related strategies
Comment
All comments (0)
No data
- 1