RedK Volume-Accelerated Directional Energy Ratio

The Volume-Accelerated Directional Energy Ratio (VADER) makes use of price moves (displacement) and the associated volume (effort) to estimate the positive (buying) and negative (selling) "energy" behind the scenes, enabling traders to "read the market action" in more details and adjust their trading decisions accordingly.
How does VADER work?
I have always been a fan of technical analysis concepts that are simple, and that integrate both price action and volume together - The concept behind VADER is really a simple one.
Let's walk though it as we avoid getting too technical:
Large price moves that are associated with large volume means buyers (if the move is up) or sellers (when the move is down) are serious and are "in control" of the action
On the other hand, when the price moves are small but with large volume , it means there's a fight, or more of a balance of energy, between buying and selling.
Also when large price moves are associated with relatively limited volume , there's a lack of "energy" from either buyers or sellers - and moves likes these are usually short-lived.
The analogy with VADER, is that we look at price moves (change of close between 2 bars) as the displacement (or action result) and the associated volume as the "effort" behind this action -- Combining these 2 values together, the displacement and the effort, gives us a representation or a proxy of the underlying energy (in a specific direction).
when both values (displacement and effort) are high, then the resulting energy is high - and if one of these values are low, the resulting energy is low.
we then take an average of that relative energy in each direction (positive = buying and negative = selling) and calculate the net energy.
note that we're approaching the analogy here from a trading perspective and not from physics perspective :) -- we can be forgiven if the energy calculation in physics is different ..
backtest
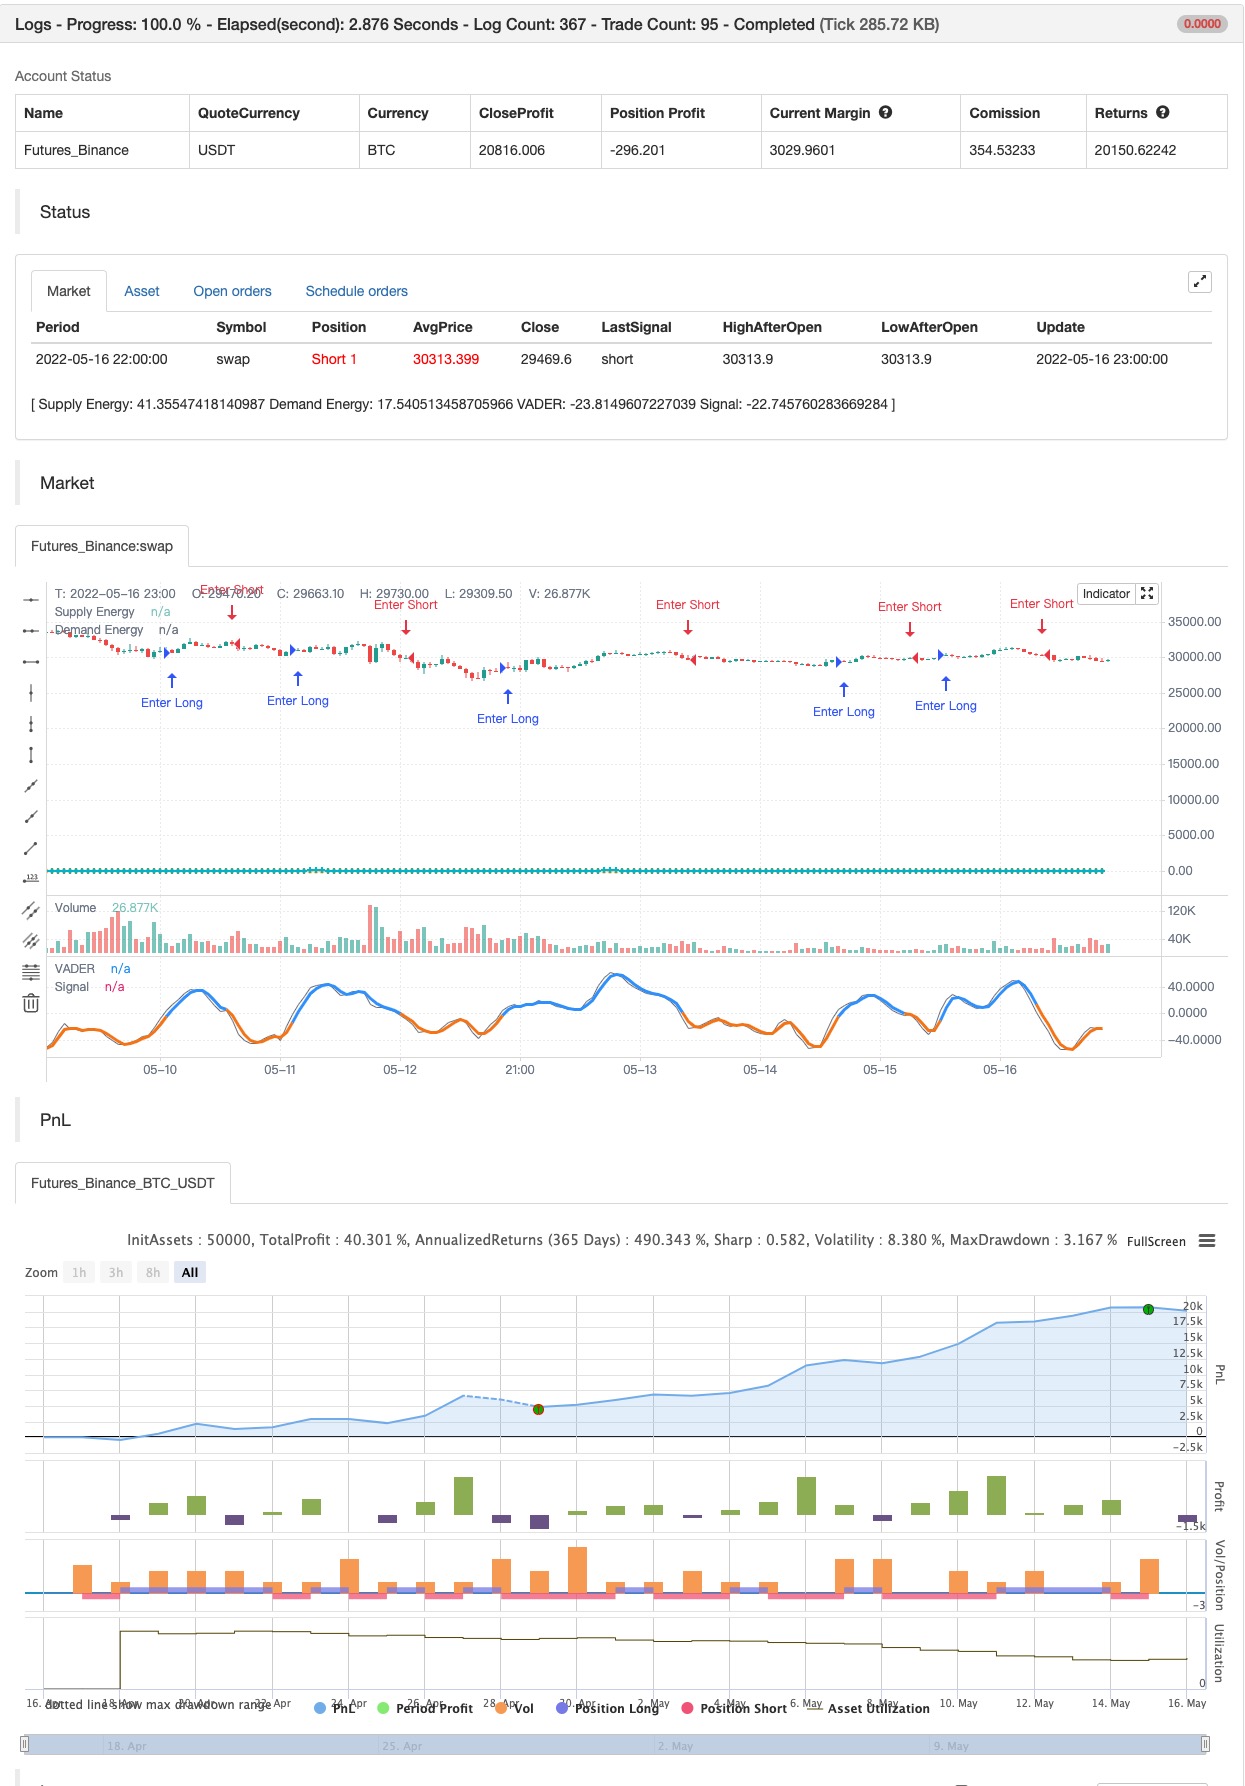
- 1