HODL LINE

Author: ChaoZhang, Date: 2022-05-20 16:58:28
Tags: HMA

This indicator determines periods of bull market when a buy-and-hold investor can hold the asset, and bear market periods when they should avoid holding it. Though it was designed primarily with cryptocurrencies in mind, it can be successfully used for any market. Technically, the indicator is an asymmetric trend filter aimed to account for the fact that market sell-offs tend to be sharper than up-trends. The algorithm has two regimes – with and without price smoothing.

HOW TO USE 
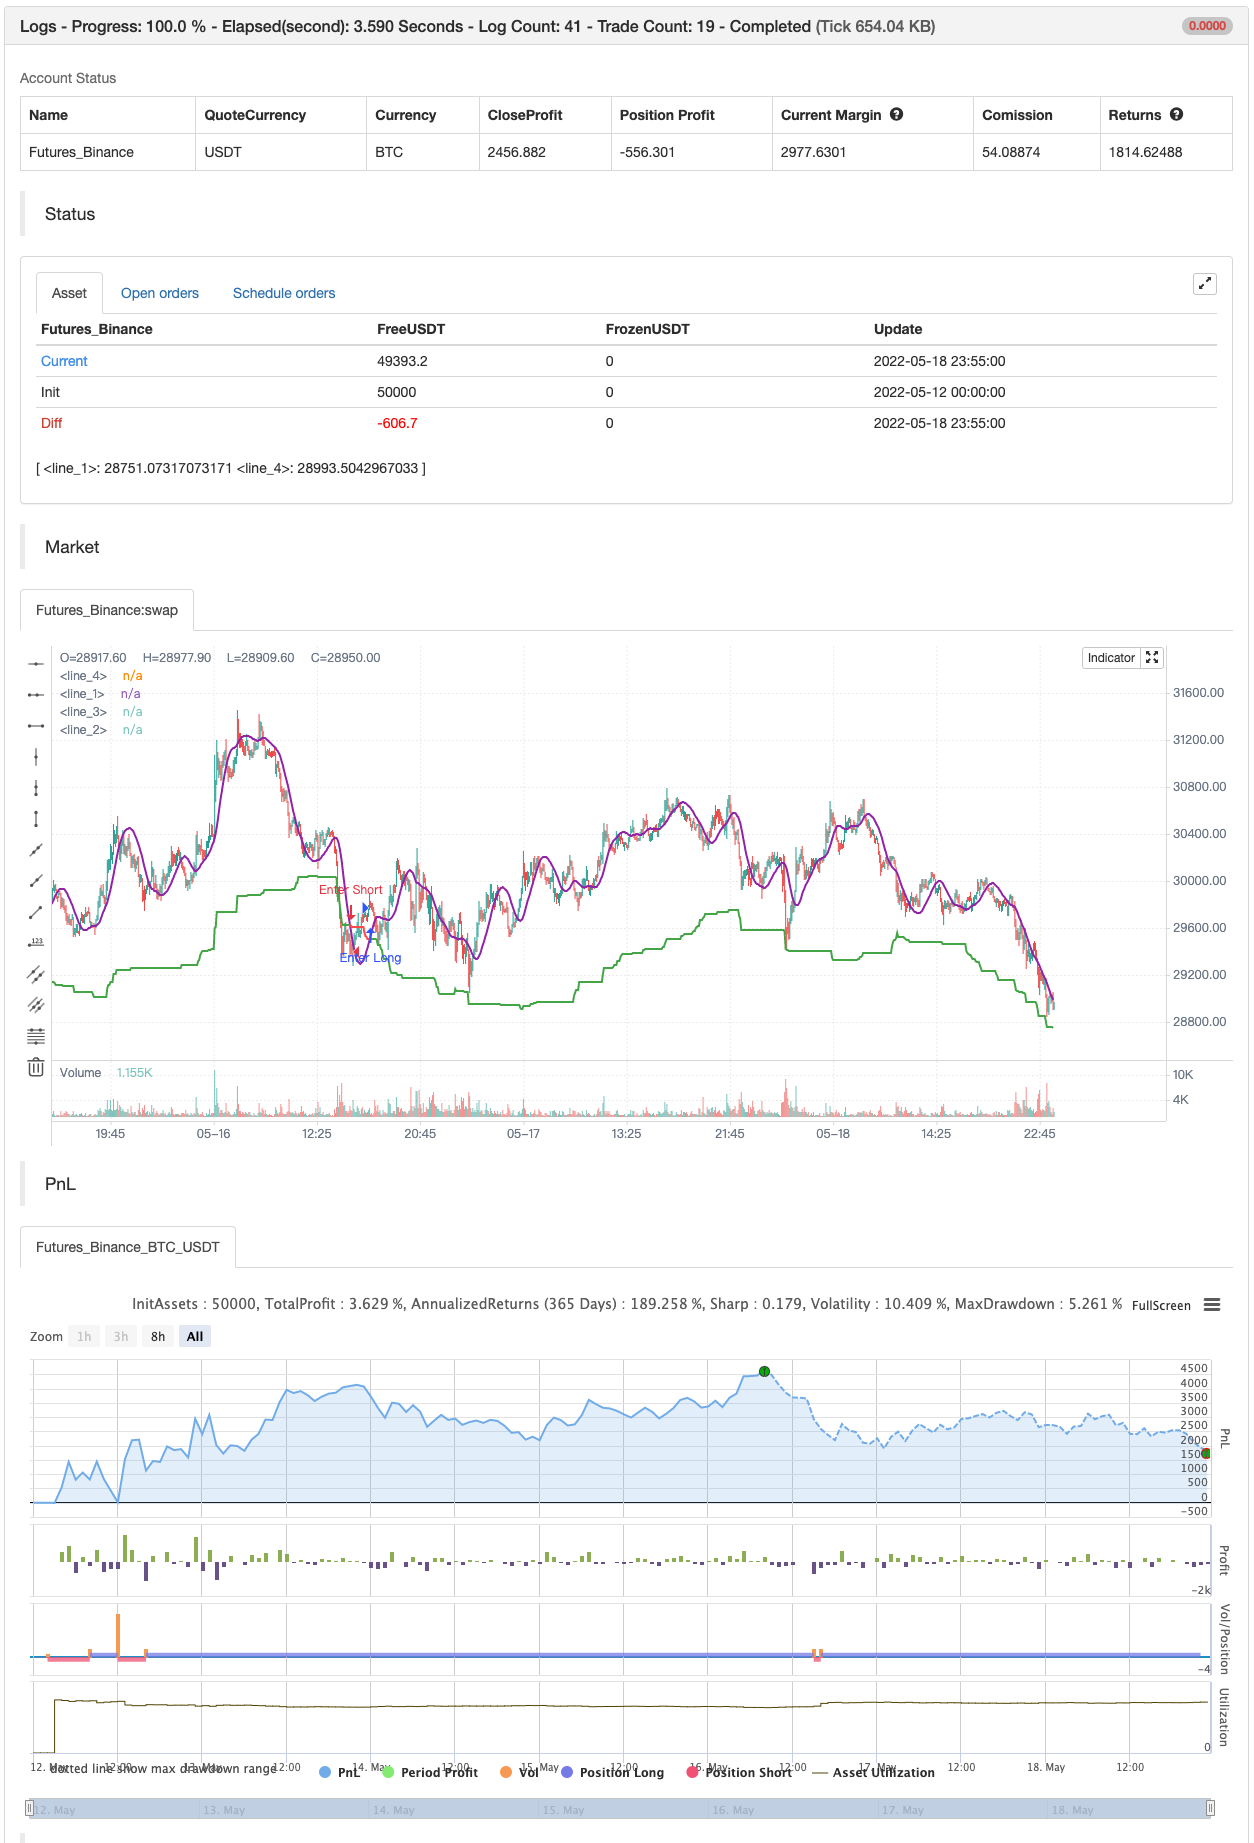
The step-like line is the main trend filter. It is colored green in an uptrend and red in a downtrend. When the smoothing is on, in addition to the trend filter, the indicator plots a purple line. It is a Hull Moving Average ( HMA ) of the price. In this case, the indicator uses this line instead of the price to find crossings with the trend filter. When the price or the smoothed line crosses the trend filter above, it is an uptrend signal. The indicator marks such crossings with green circles. It also colors the chart background green in an uptrend. The price or the purple line crossing the trend filter below means a downtrend signal. Downtrend signals show as red circles. The chart background in a downtrend turns red.

SETTINGS Sensitivity – a dropdown list that allows the user to choose an averaging period of the indicator. Users can select a value for sensitivity from a predetermined set that better suits their investment horizon. Use Smoothing – turns on and off smoothing of the price with HMA . With the smoothing turned on, the indicator responds slower to price changes, but at the same time produces less amount of false signals.

backtest

img


/*backtest
start: 2022-05-12 00:00:00
end: 2022-05-18 23:59:00
period: 5m
basePeriod: 1m
exchanges: [{"eid":"Futures_Binance","currency":"BTC_USDT"}]
*/

// This source code is subject to the terms of the Mozilla Public License 2.0 at https://mozilla.org/MPL/2.0/
// © AstrideUnicorn

// Asymmetrical Trend Filter aka HODL Line

//@version=5
indicator("HODL LINE", overlay=true)

// initialize indicator period parameter and the asymmetry paramter
length = 300
asymmetry =  0.05 //input.float(defval=0.05,step=0.01, minval=0.01, maxval=0.3)

// script inputs
sensitivity = input.string(defval="Hold Short Term", title="Sensitivity", options=['Super Sensitive','Hold Short Term', 'Hold Medium Term', 'Hold Long Term'])
use_smoothing = input.bool(defval=true, title="Use Smoothing")


// Set the indicator period based on the choosen sensitivity 
if sensitivity == 'Super Sensitive'
    length:=50

if sensitivity == 'Hold Short Term'
    length:=100

if sensitivity == 'Hold Medium Term'
    length:=300
    
if sensitivity == 'Hold Long Term'
    length:=500    

// Calculate HODL Line - an assymetric trend filter
HODL_line = (ta.highest(close,length) + ta.lowest(close,length))/(2.0 + asymmetry)

// Calculate smoothed price time series
smoothed_price = ta.hma(close,50)

// Use closing price or smoothed price based on the choosen option for smoothing
price_model = use_smoothing ? smoothed_price : close

// Define conditional color for the HODL Line
hodl_line_color = price_model >= HODL_line ? color.green : color.red

// define the HODL Line crossing conditions
crossing_condition_bull = ta.crossover(price_model, HODL_line)
crossing_condition_bear = ta.crossunder(price_model, HODL_line)

// plotting
plot(HODL_line, color = hodl_line_color, linewidth = 2)

plot(crossing_condition_bull?HODL_line:na, color = color.new(color.green,40), style= plot.style_circles, linewidth = 20)
plot(crossing_condition_bear?HODL_line:na, color = color.new(color.red,40), style= plot.style_circles, linewidth = 20)

bgcolor(color.new(hodl_line_color,80))

plot(use_smoothing?price_model:na, color=color.purple, linewidth=2)

if crossing_condition_bull
    strategy.entry("Enter Long", strategy.long)
else if crossing_condition_bear
    strategy.entry("Enter Short", strategy.short)

Related

More