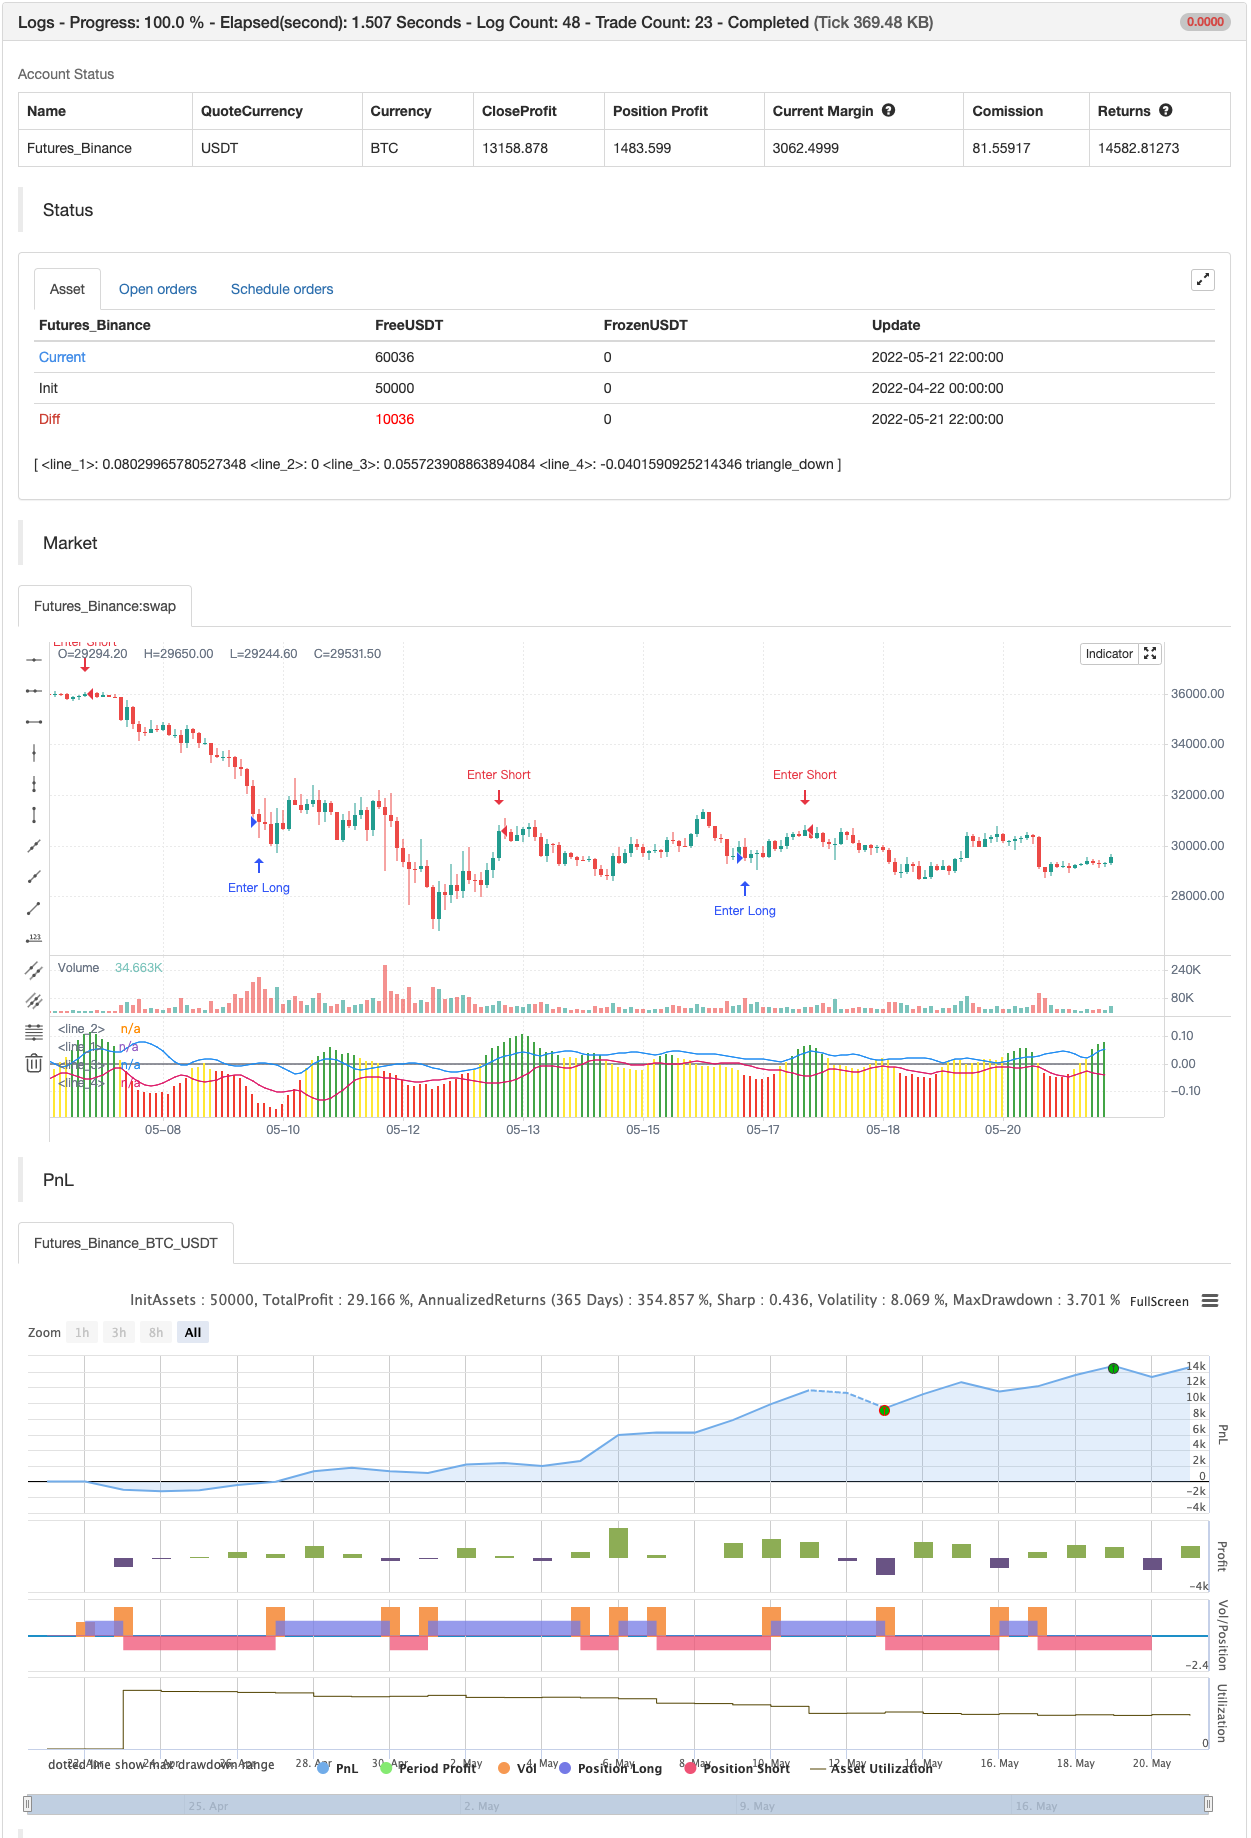
Version 2, Shannon Entropy This update includes both a deadband (Plotting Optional) and PercentRank Indicating.
Here is a unique way of looking at your price & volume information. Utilize the calculated value of “Shannon Entropy”. This is a measure of “surprise” in the data, the larger the move or deviation from the most probable value, the higher the new information gain. What I think is so interesting about this value, is the smoothness that it displays the information without using moving averages. There is a lot of meat on this bone to be incorporated in other scripts.
H = -sum(prob(i) * log_base2(prob(i)))
I’ve included the typical way that I’ve been experimenting with this, which is the difference between the volume information and price information. I’ve included the option to turn either price or volume data off to see the Shannon Entropy value of either value. There are a ton of complex scripts out there trying to do what this calculation is doing in 3 lines. As with anything, there are no free lunches, so you can nicely see as you lower the lengths you’ll quickly learn where your nyquist frequencies are at, you’ll want to work at about double the noisy value at a minimum.
Using this script is based on “Information” and it highlights places that need your attention, either because there is a large amount of change (new information) or there is minimal new information (complacency, institutional movements). Buy and Sell points are up to the user, this is just showing you where you need to provide some attention. backtest

/*backtest
start: 2022-04-22 00:00:00
end: 2022-05-21 23:59:00
period: 2h
basePeriod: 15m
exchanges: [{"eid":"Futures_Binance","currency":"BTC_USDT"}]
*/

// This source code is subject to the terms of the Mozilla Public License 2.0 at https://mozilla.org/MPL/2.0/
// © kocurekc

//@version=4
//
// @author Kocurekc
// Rev-3, Added STDev bands and Precent Rank
// Rev-2, Shannon entropy
// Rev-1, new picture for moderators
// Rev-0, added colors, flipped delta to clean up view
//
// Live a little, publish your scripts...be a John Elhers
//

study(title="Shannon Entropy V2", shorttitle="Info-S", precision=2)
src = input(close, title="source", type=input.source)
len = input(9, title="Entropy Length", type=input.integer)
range = input(0.025, title="color level", type=input.float)
avg = input(44, title="Averaging Length", type=input.integer)
vPR = input(2, title="Percent Rank Limit", type=input.integer)
bc = input(true, title="Include Source", type=input.bool)
vc = input(true, title="Include Volume", type=input.bool)
pb = input(true, title="Print Bands", type=input.bool)

//Shannon Entropy, for source (close) or for Volume or both
cr = src/sum(src,len)
vr = log(volume)/sum(log(volume),len)
info = ((vc ? sum(vr*log10(vr)/log10(2),len) : 0) - (bc ? vc ? sum(cr*log10(cr)/log10(2),len) : sum(cr*log10(cr)/log10(2),len) : 0))

//coloring for Shannon Entropy using both source and volume
hc1 = info > range ? #4caf50 : info > range * -1 ? #ffeb3b : info <= range * -1 ? #f44336 : na

//Plotting
plot(info, style=(bc and vc ? plot.style_columns :plot.style_line ), color=hc1 )
plot((bc and vc ? 0 : na), color=color.gray)


//Top/Bottom STDev
value = wma(info,avg)
top = value+stdev(info,len)
btm = value-stdev(info,len)
plot(pb ? top:na)
plot(pb ? btm:na)

//Percent Rank and ploting
hvp = percentrank(info,avg)
plotshape(hvp>(100-vPR) ? info : na, location=location.absolute, style=shape.triangledown, color=color.red, size=size.tiny, transp=30, offset=0)
plotshape(hvp<vPR ? info : na, location=location.absolute, style=shape.triangleup, color=color.green, size=size.tiny, transp=30, offset=0)

if hvp<vPR
    strategy.entry("Enter Long", strategy.long)
else if hvp>(100-vPR)
    strategy.entry("Enter Short", strategy.short)