RedK Dual VADER with Energy Bars

The visual improvements I added in VADER-DEB helps bring more insight about the market action by
- exposing the dual/long VADER plot by default (which we use as a proxy for sentiment) - and it shows now as an area (instead of a histogram) - You can still hide the sentiment plot in indicator settings
and - by using directional "energy bars" (instead of energy lines in v3.0). Optional Red/Green DER Lines are available in study settings and are hidden by default.
So this is Dual VADER w/ Energy Bars -- or VADER-DEB for short.
These changes may be considered by some as small, but in my view, I found them to be more visually appealing and better for "driving action" - This works better for me as a visual person - so i thought to share with others who may be like me .. This is why i decided to publish this as a separate version and not as an update to the existing indicator - so you can make the choice which one you prefer to use.
There's no change in the core calculation within the code. As shown by the chart above where we compare both VADER versions side-by-side.
If you're happy with VADER v3.0, please feel free to continue to use it.
good luck !
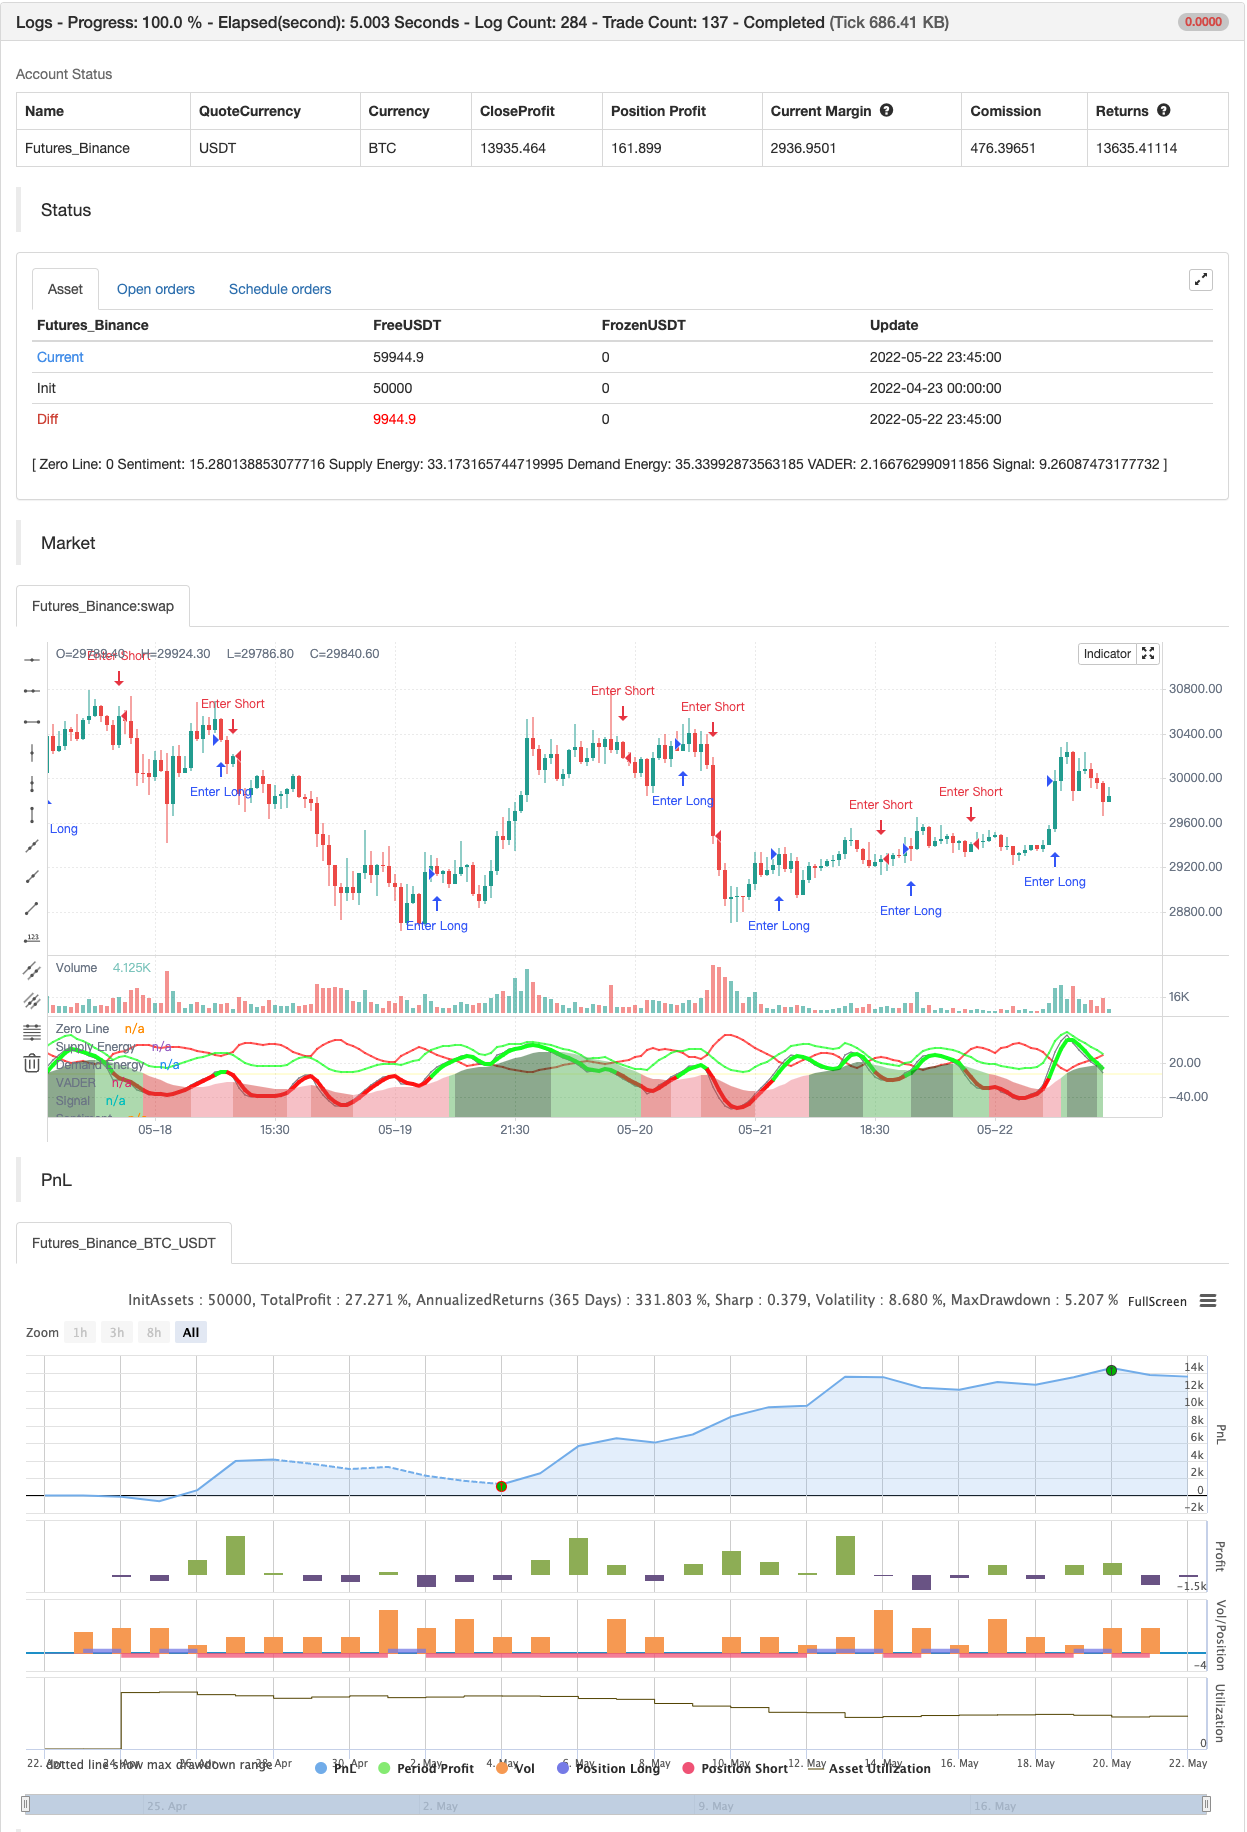
backtest
- 1