Matrix Series

Author: ChaoZhang, Date: 2022-05-24 16:42:26
Tags: EMACCI

For those who are using charts with white backround they should change from the indicator options->style the black color to white. 
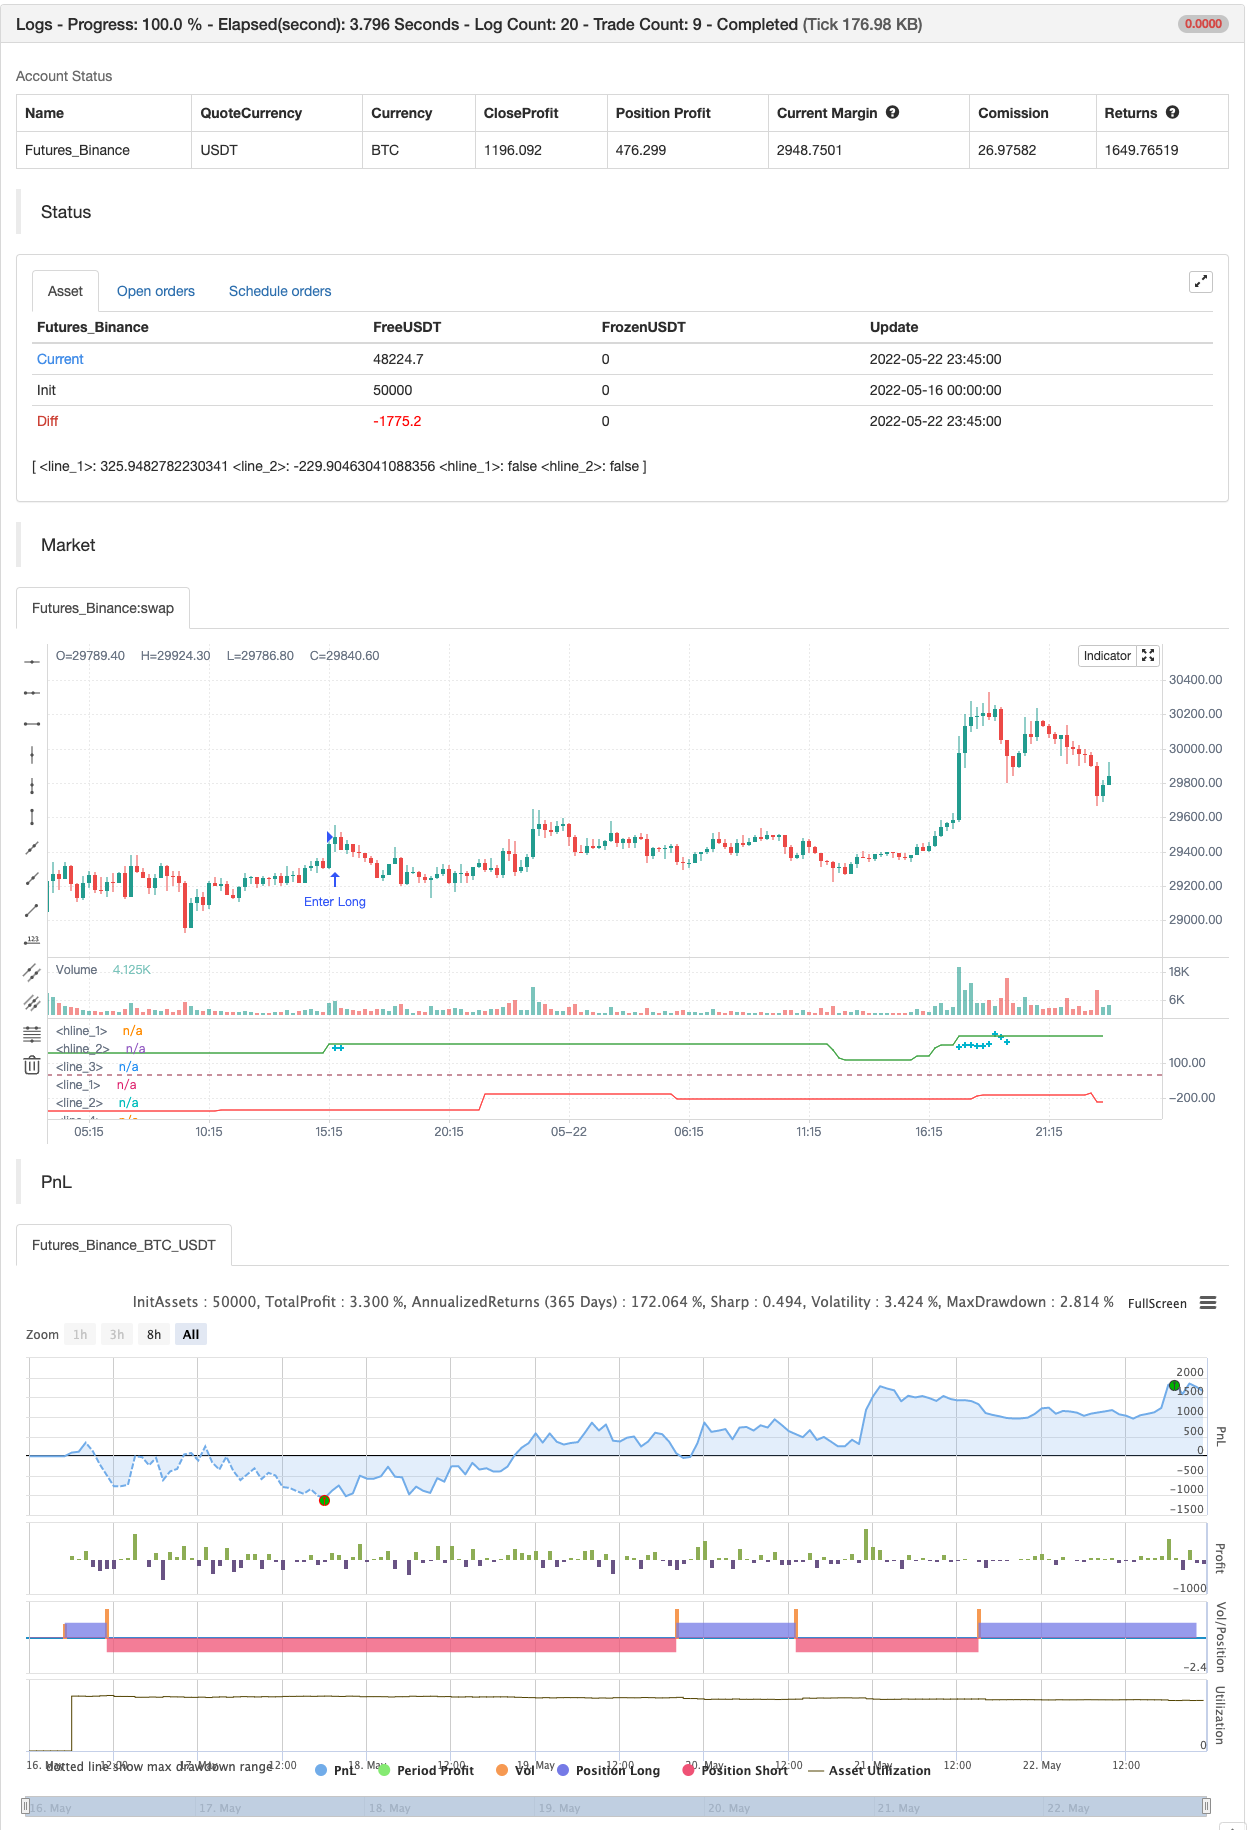
OB/OS zones are at 200 and -200 and marked with aqua color above below the candles.

backtest

img


/*backtest
start: 2022-05-16 00:00:00
end: 2022-05-22 23:59:00
period: 15m
basePeriod: 5m
exchanges: [{"eid":"Futures_Binance","currency":"BTC_USDT"}]
*/

study("Matrix Series",shorttitle="MS",precision=1)
Smoother=input(5)
nn = Smoother
//--Sup/Res Detail
SupResPeriod = input(50)
SupResPercentage =input(100)
PricePeriod = input(16)
ob = input(200,title="Overbought")
os = input(-200,title="Oversold")
OBOS= input(type=bool,defval=false,title="Show OB/OS") 
dynamic=input(true,title="Dynamic zones")
ys1 = ( high + low + close * 2 ) / 4
rk3 = ta.ema( ys1, nn )
rk4 = ta.stdev(ys1, nn)
rk5 = (ys1 - rk3 ) * 200 / rk4
rk6 = ta.ema( rk5, nn )
up = ta.ema(rk6, nn )
down = ta.ema( up, nn )
Oo = iff( up < down, up, down )
Hh = Oo
Ll = iff( up < down, down, up )
Cc = Ll
vcolor= Oo > Cc ? red : up > down? color.green:color.red 

//plotcandle(Oo,Hh,Ll,Cc,color=vcolor)


//-------S/R Zones------
Lookback = SupResPeriod
PerCent = SupResPercentage
Pds = PricePeriod

C3 = ta.cci(close,Pds )

Osc = C3
Value1 = Osc
Value2 = ta.highest( Value1, Lookback )
Value3 = ta.lowest( Value1, Lookback )
Value4 = Value2 - Value3
Value5 = Value4 * ( PerCent / 100 )
ResistanceLine = Value3 + Value5
SupportLine = Value2 - Value5
plot(dynamic?ResistanceLine:na,color=color.green,transp=0)
plot(dynamic?SupportLine:na,color=color.red,transp=0)

//--Overbought/Oversold/Warning Detail
UPshape = up > ob and up>down ? ta.highest(up,1) + 20:up > ob and up<down? ta.highest(down,1) + 20:na
DOWNshape = down < os and up>down ? ta.lowest(down,1) - 20:down < os and up<down? ta.lowest(up,1) - 20 :na
plot(UPshape,style=plot.style_cross,color=color.aqua,linewidth=2,transp=0)
plot(DOWNshape,style=plot.style_cross,color=color.aqua,linewidth=2,transp=0)
x1=OBOS?ob:false
x2=OBOS?os:false
hline(x1)
hline(x2)
//http://www.wisestocktrader.com/indicators/2739-flower-indicator


if UPshape
    strategy.entry("Enter Long", strategy.long)
else if DOWNshape
    strategy.entry("Enter Short", strategy.short)

Related

More