
Both MOST and SuperTrend Indicators are very good at trend following systems but conversely their performance is not bright in sideways market conditions like most of the other indicators.
Profit Maximizer - PMax tries to solve this problem. PMax combines the powerful sides of MOST (Moving Average Trend Changer) and SuperTrend (ATR price detection) in one indicator.
Backtest and optimization results of PMax are far better when compared to its ancestors MOST and SuperTrend. It reduces the number of false signals in sideways and give more reliable trade signals.
PMax is easy to determine the trend and can be used in any type of markets and instruments. It does not repaint.
The first parameter in the PMax indicator set by the three parameters is the period/length of ATR.
The second Parameter is the Multiplier of ATR which would be useful to set the value of distance from the built in Moving Average.
I personally think the most important parameter is the Moving Average Length and type.
PMax will be much sensitive to trend movements if Moving Average Length is smaller. And vice versa, will be less sensitive when it is longer.
As the period increases it will become less sensitive to little trends and price actions.
In this way, your choice of period, will be closely related to which of the sort of trends you are interested in.
We are under the effect of the uptrend in cases where the Moving Average is above PMax;
conversely under the influence of a downward trend, when the Moving Average is below PMax.
Built in Moving Average type defaultly set as EMA but users can choose from 8 different Moving Average types like:
SMA : Simple Moving Average
EMA : Exponential Movin Average
WMA : Weighted Moving Average
TMA : Triangular Moving Average
VAR : Variable Index Dynamic Moving Average aka VIDYA
WWMA : Welles Wilder's Moving Average
ZLEMA : Zero Lag Exponential Moving Average
TSF : True Strength Force
Tip: In sideways VAR would be a good choice
You can use PMax default alarms and Buy Sell signals like:
1-
BUY when Moving Average crosses above PMax
SELL when Moving Average crosses under PMax
2-
BUY when prices jumps over PMax line.
SELL when prices go under PMax line.
backtest
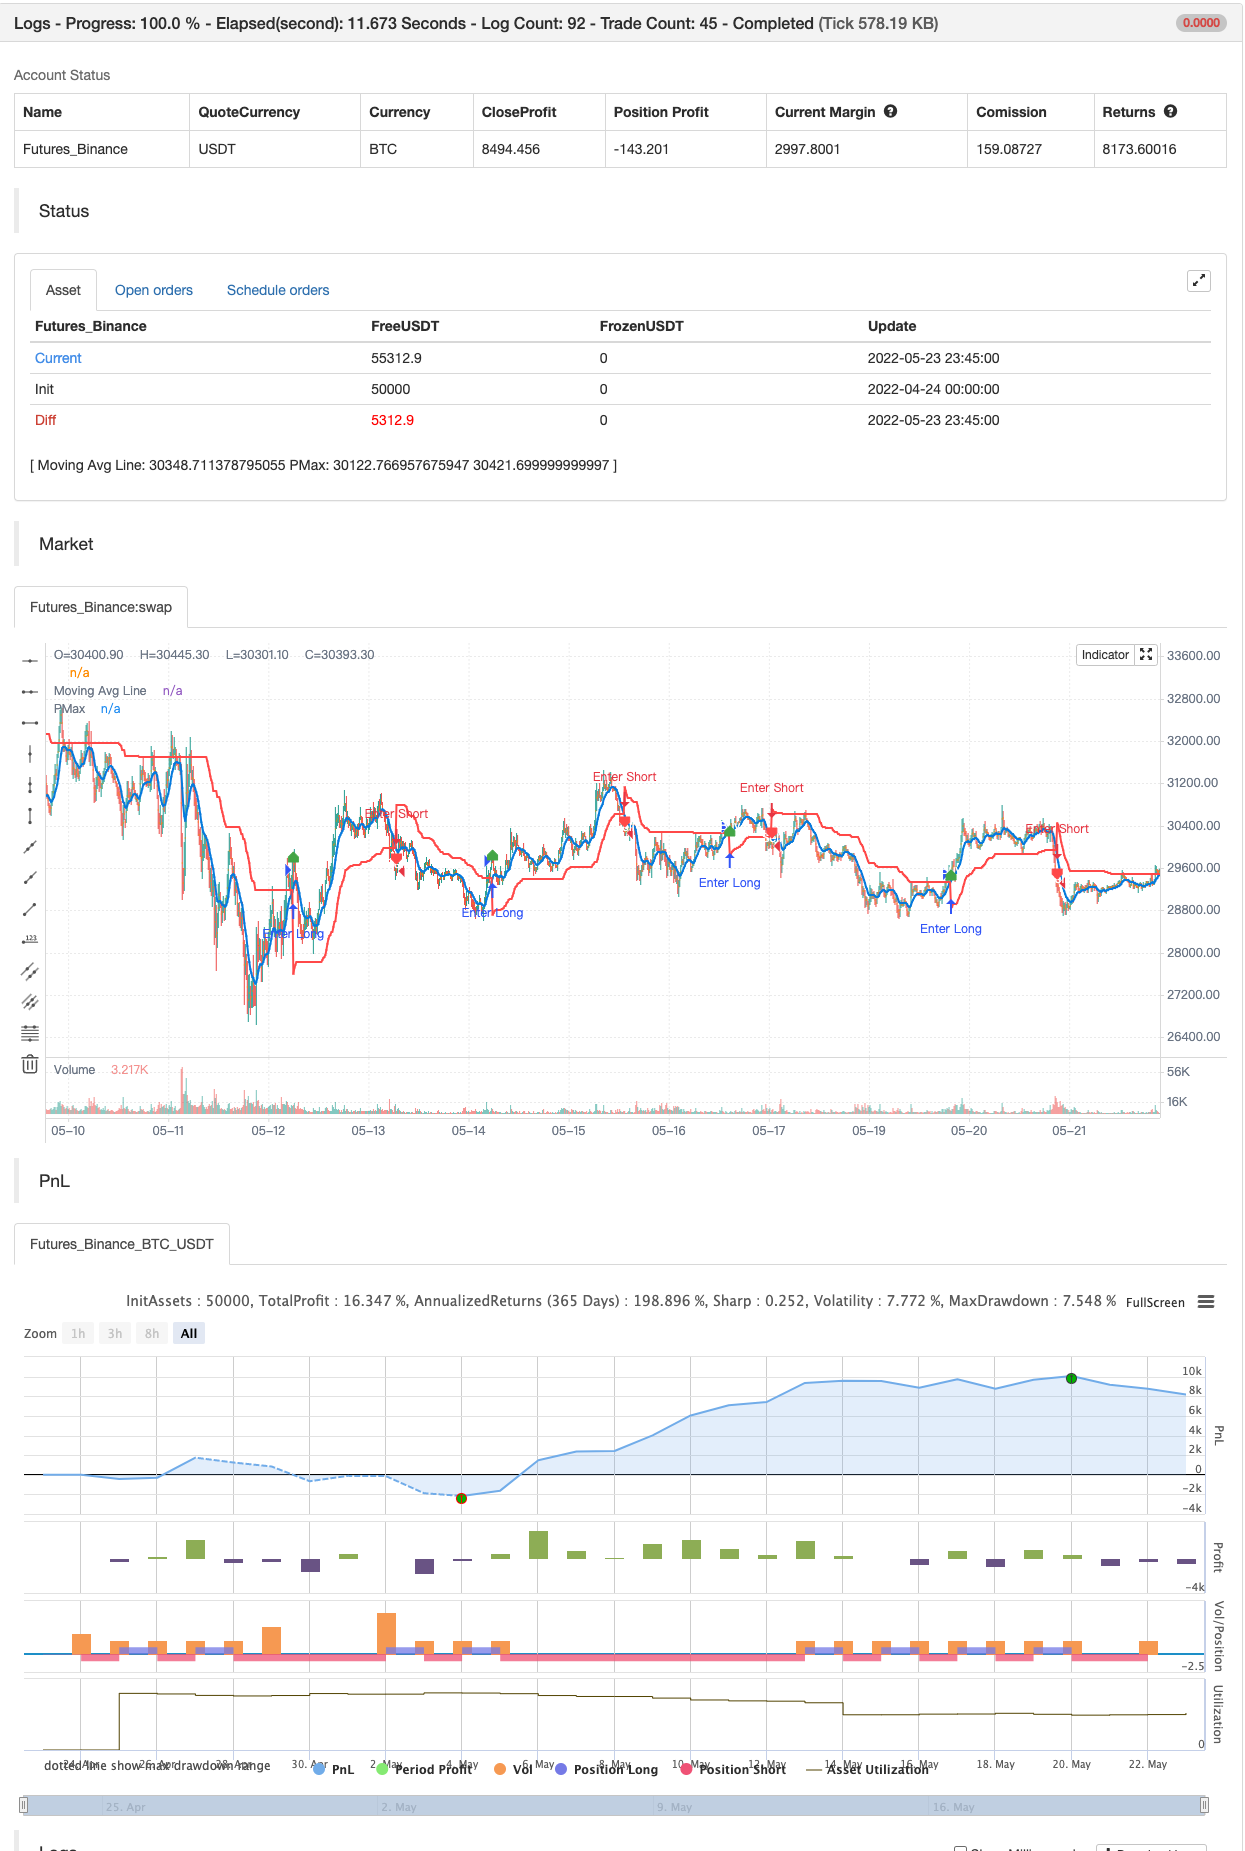
/*backtest
start: 2022-04-24 00:00:00
end: 2022-05-23 23:59:00
period: 15m
basePeriod: 5m
exchanges: [{"eid":"Futures_Binance","currency":"BTC_USDT"}]
*/

//@version=4
// This source code is subject to the terms of the Mozilla Public License 2.0 at https://mozilla.org/MPL/2.0/
// © KivancOzbilgic
//developer: @KivancOzbilgic- 1