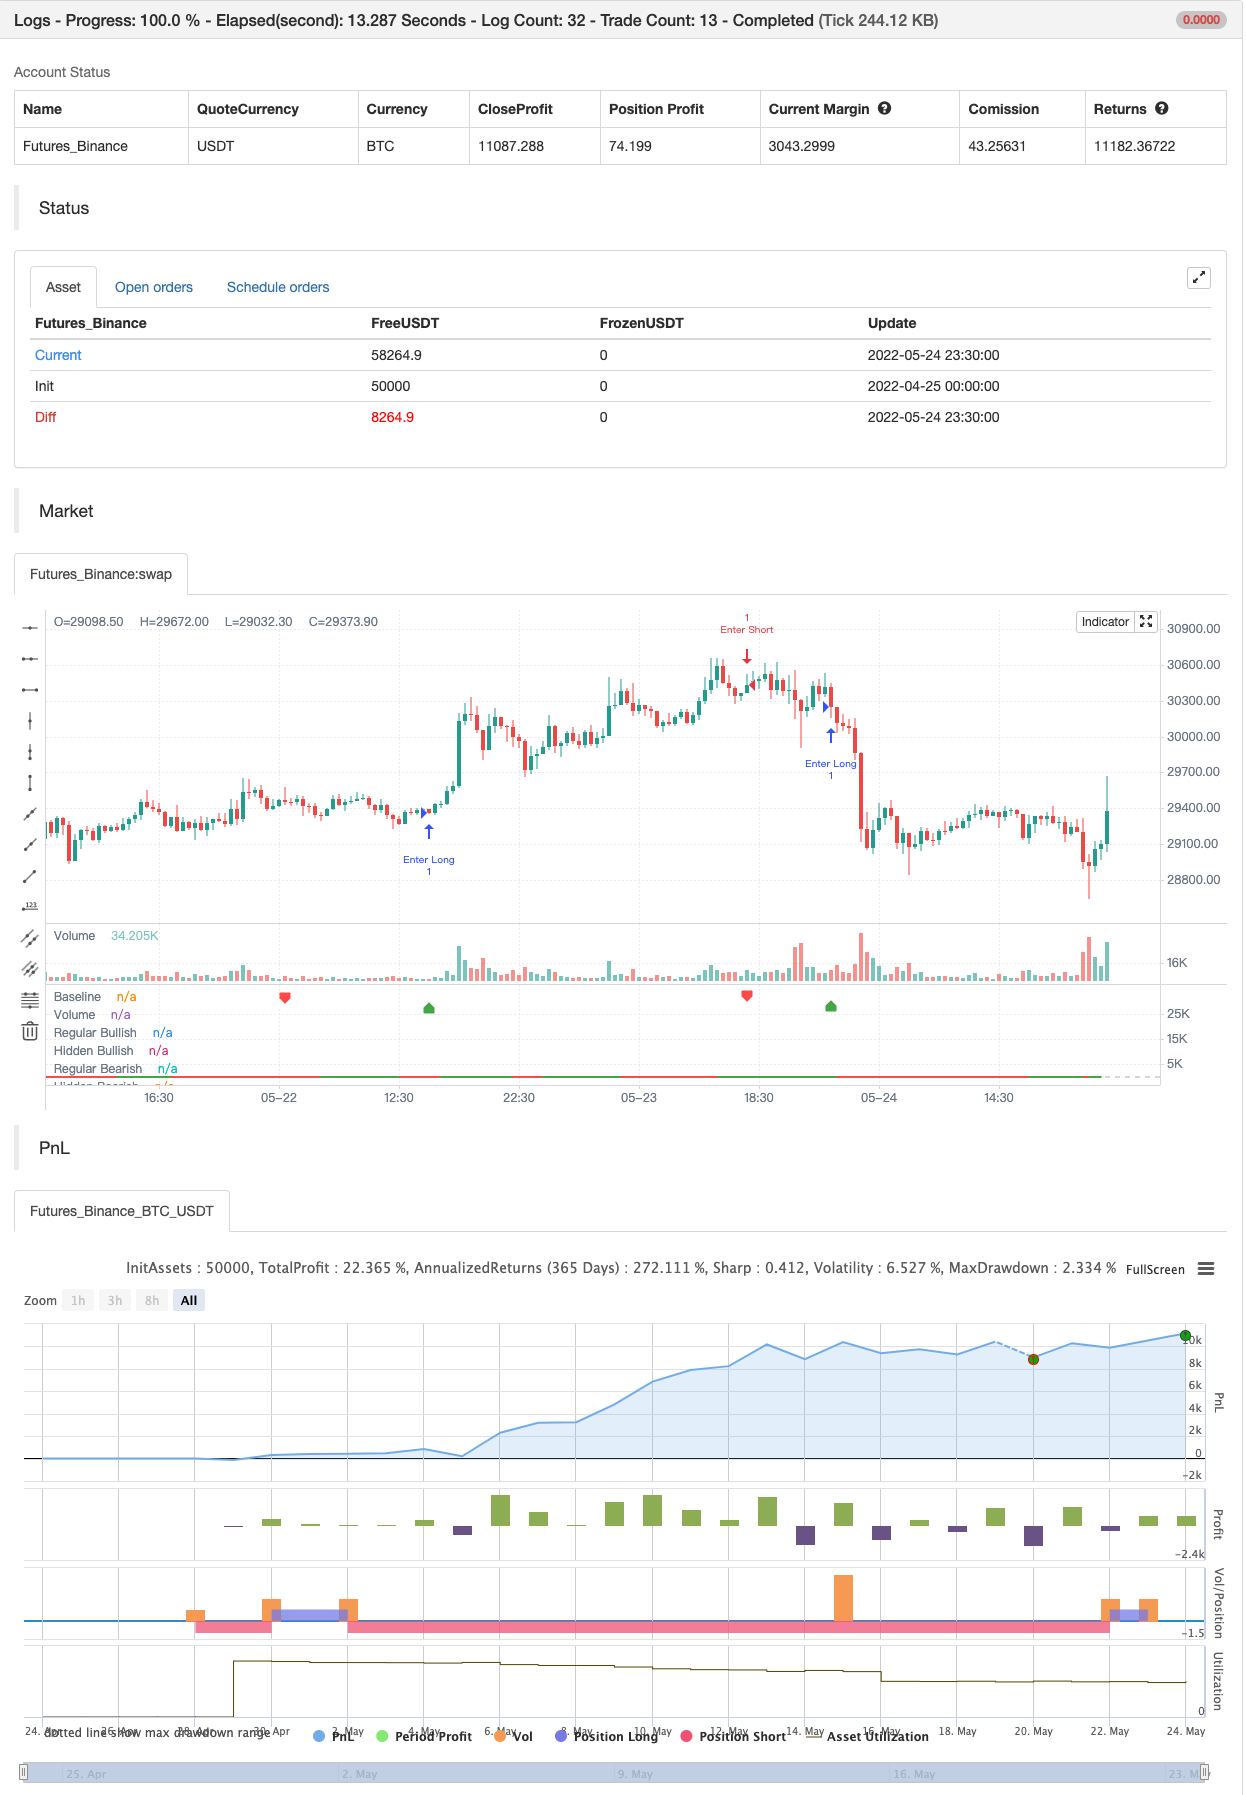
Volume Divergence

Author: ChaoZhang, Date: 2022-05-26 17:04:32
Tags: WMAPivot

It’s a simply volume indicator. You should watch for breaks on both volume uptrend and volume downtrend. It uses fibonacci numbers to build smoothed moving average of volume .

Also you can check divergences for trend reversal and momentum loss.

backtest

img


/*backtest
start: 2022-04-25 00:00:00
end: 2022-05-24 23:59:00
period: 30m
basePeriod: 15m
exchanges: [{"eid":"Futures_Binance","currency":"BTC_USDT"}]
*/

// This source code is subject to the terms of the Mozilla Public License 2.0 at https://mozilla.org/MPL/2.0/
// © baymucuk

//@version=4
study(title="Volume Divergence by MM", shorttitle="Volume Divergence", format=format.volume)

pine_wma(x, y) =>
    norm = 0.0
    sum = 0.0
    for i = 0 to y - 1
        weight = (y - i) * y
        norm := norm + weight
        factor = close[i] < open[i] ? -1 : 1
        sum := sum + (x[i] * weight * factor)
    sum / norm

vl1 = input(defval=5, title="First Moving Average length", type=input.integer)
vl2 = input(defval=8, title="Second Moving Average length", type=input.integer)
vl3 = vl1 + vl2
vl4 = vl2 + vl3
vl5 = vl3 + vl4

v1 = pine_wma(volume, vl1)
v2 = pine_wma(v1, vl2)
v3 = pine_wma(v2, vl3)
v4 = pine_wma(v3, vl4)
vol = pine_wma(v4, vl5)

vol_color = vol > 0 ? color.green : color.red
hline(0, title="Baseline", color=color.silver, linewidth=1)
plot(vol, color=vol_color, linewidth=2, title="Volume")

lbR = input(title="Pivot Lookback Right", defval=5)
lbL = input(title="Pivot Lookback Left", defval=5)
rangeUpper = input(title="Max of Lookback Range", defval=60)
rangeLower = input(title="Min of Lookback Range", defval=5)
plotBull = input(title="Plot Bullish", defval=true)
plotHiddenBull = input(title="Plot Hidden Bullish", defval=false)
plotBear = input(title="Plot Bearish", defval=true)
plotHiddenBear = input(title="Plot Hidden Bearish", defval=false)

bearColor = color.red
bullColor = color.green
hiddenBullColor = color.new(color.green, 25)
hiddenBearColor = color.new(color.red, 25)
textColor = color.white
noneColor = color.new(color.white, 100)

plFound = na(pivotlow(vol, lbL, lbR)) ? false : true
phFound = na(pivothigh(vol, lbL, lbR)) ? false : true

_inRange(cond) =>
    bars = barssince(cond == true)
    rangeLower <= bars and bars <= rangeUpper

//------------------------------------------------------------------------------
// Regular Bullish

// vol: Higher Low
volHL = vol[lbR] > valuewhen(plFound, vol[lbR], 1) and _inRange(plFound[1])

// Price: Lower Low
priceLL = low[lbR] < valuewhen(plFound, low[lbR], 1)

bullCond = plotBull and priceLL and volHL and plFound

plot(
	 plFound ? vol[lbR] : na,
	 offset=-lbR,
	 title="Regular Bullish",
	 linewidth=2,
	 color=(bullCond ? bullColor : noneColor),
	 transp=0
	 )

plotshape(
	 bullCond ? vol[lbR] : na,
	 offset=-lbR,
	 title="Regular Bullish Label",
	 text=" Bull ",
	 style=shape.labelup,
	 location=location.absolute,
	 color=bullColor,
	 textcolor=textColor,
	 transp=0
	 )

//------------------------------------------------------------------------------
// Hidden Bullish

// vol: Lower Low
volLL = vol[lbR] < valuewhen(plFound, vol[lbR], 1) and _inRange(plFound[1])

// Price: Higher Low
priceHL = low[lbR] > valuewhen(plFound, low[lbR], 1)

hiddenBullCond = plotHiddenBull and priceHL and volLL and plFound

plot(
	 plFound ? vol[lbR] : na,
	 offset=-lbR,
	 title="Hidden Bullish",
	 linewidth=2,
	 color=(hiddenBullCond ? hiddenBullColor : noneColor),
	 transp=0
	 )

plotshape(
	 hiddenBullCond ? vol[lbR] : na,
	 offset=-lbR,
	 title="Hidden Bullish Label",
	 text=" H Bull ",
	 style=shape.labelup,
	 location=location.absolute,
	 color=bullColor,
	 textcolor=textColor,
	 transp=0
	 )

//------------------------------------------------------------------------------
// Regular Bearish

// vol: Lower High
volLH = vol[lbR] < valuewhen(phFound, vol[lbR], 1) and _inRange(phFound[1])

// Price: Higher High
priceHH = high[lbR] > valuewhen(phFound, high[lbR], 1)

bearCond = plotBear and priceHH and volLH and phFound

plot(
	 phFound ? vol[lbR] : na,
	 offset=-lbR,
	 title="Regular Bearish",
	 linewidth=2,
	 color=(bearCond ? bearColor : noneColor),
	 transp=0
	 )

plotshape(
	 bearCond ? vol[lbR] : na,
	 offset=-lbR,
	 title="Regular Bearish Label",
	 text=" Bear ",
	 style=shape.labeldown,
	 location=location.absolute,
	 color=bearColor,
	 textcolor=textColor,
	 transp=0
	 )

//------------------------------------------------------------------------------
// Hidden Bearish

// vol: Higher High
volHH = vol[lbR] > valuewhen(phFound, vol[lbR], 1) and _inRange(phFound[1])

// Price: Lower High
priceLH = high[lbR] < valuewhen(phFound, high[lbR], 1)

hiddenBearCond = plotHiddenBear and priceLH and volHH and phFound

plot(
	 phFound ? vol[lbR] : na,
	 offset=-lbR,
	 title="Hidden Bearish",
	 linewidth=2,
	 color=(hiddenBearCond ? hiddenBearColor : noneColor),
	 transp=0
	 )

plotshape(
	 hiddenBearCond ? vol[lbR] : na,
	 offset=-lbR,
	 title="Hidden Bearish Label",
	 text=" H Bear ",
	 style=shape.labeldown,
	 location=location.absolute,
	 color=bearColor,
	 textcolor=textColor,
	 transp=0
	 )


if bullCond
    strategy.entry("Enter Long", strategy.long)
else if bearCond
    strategy.entry("Enter Short", strategy.short)

Related

More