Delta-RSI Oscillator Strategy

Delta-RSI Oscillator Strategy:
This strategy illustrates the use of the recently published Delta-RSI Oscillator as a stand-alone indicator.
Delta-RSI represents a smoothed time derivative of the RSI , plotted as a histogram and serving as a momentum indicator .
There are three optional conditions to generate trading signals (set separately for Buy, Sell and Exit signals):
Zero-crossing: bullish when D-RSI crosses zero from negative to positive values ( bearish otherwise)
Signal Line Crossing: bullish when D-RSI crosses from below to above the signal line ( bearish otherwise)
Direction Change: bullish when D-RSI was negative and starts ascending ( bearish otherwise)
Since D-RSI oscillator is based on polynomial fitting of the RSI curve, there is also an option to filter trade signal by means of the root mean-square error of the fit (normalized by the sample average).
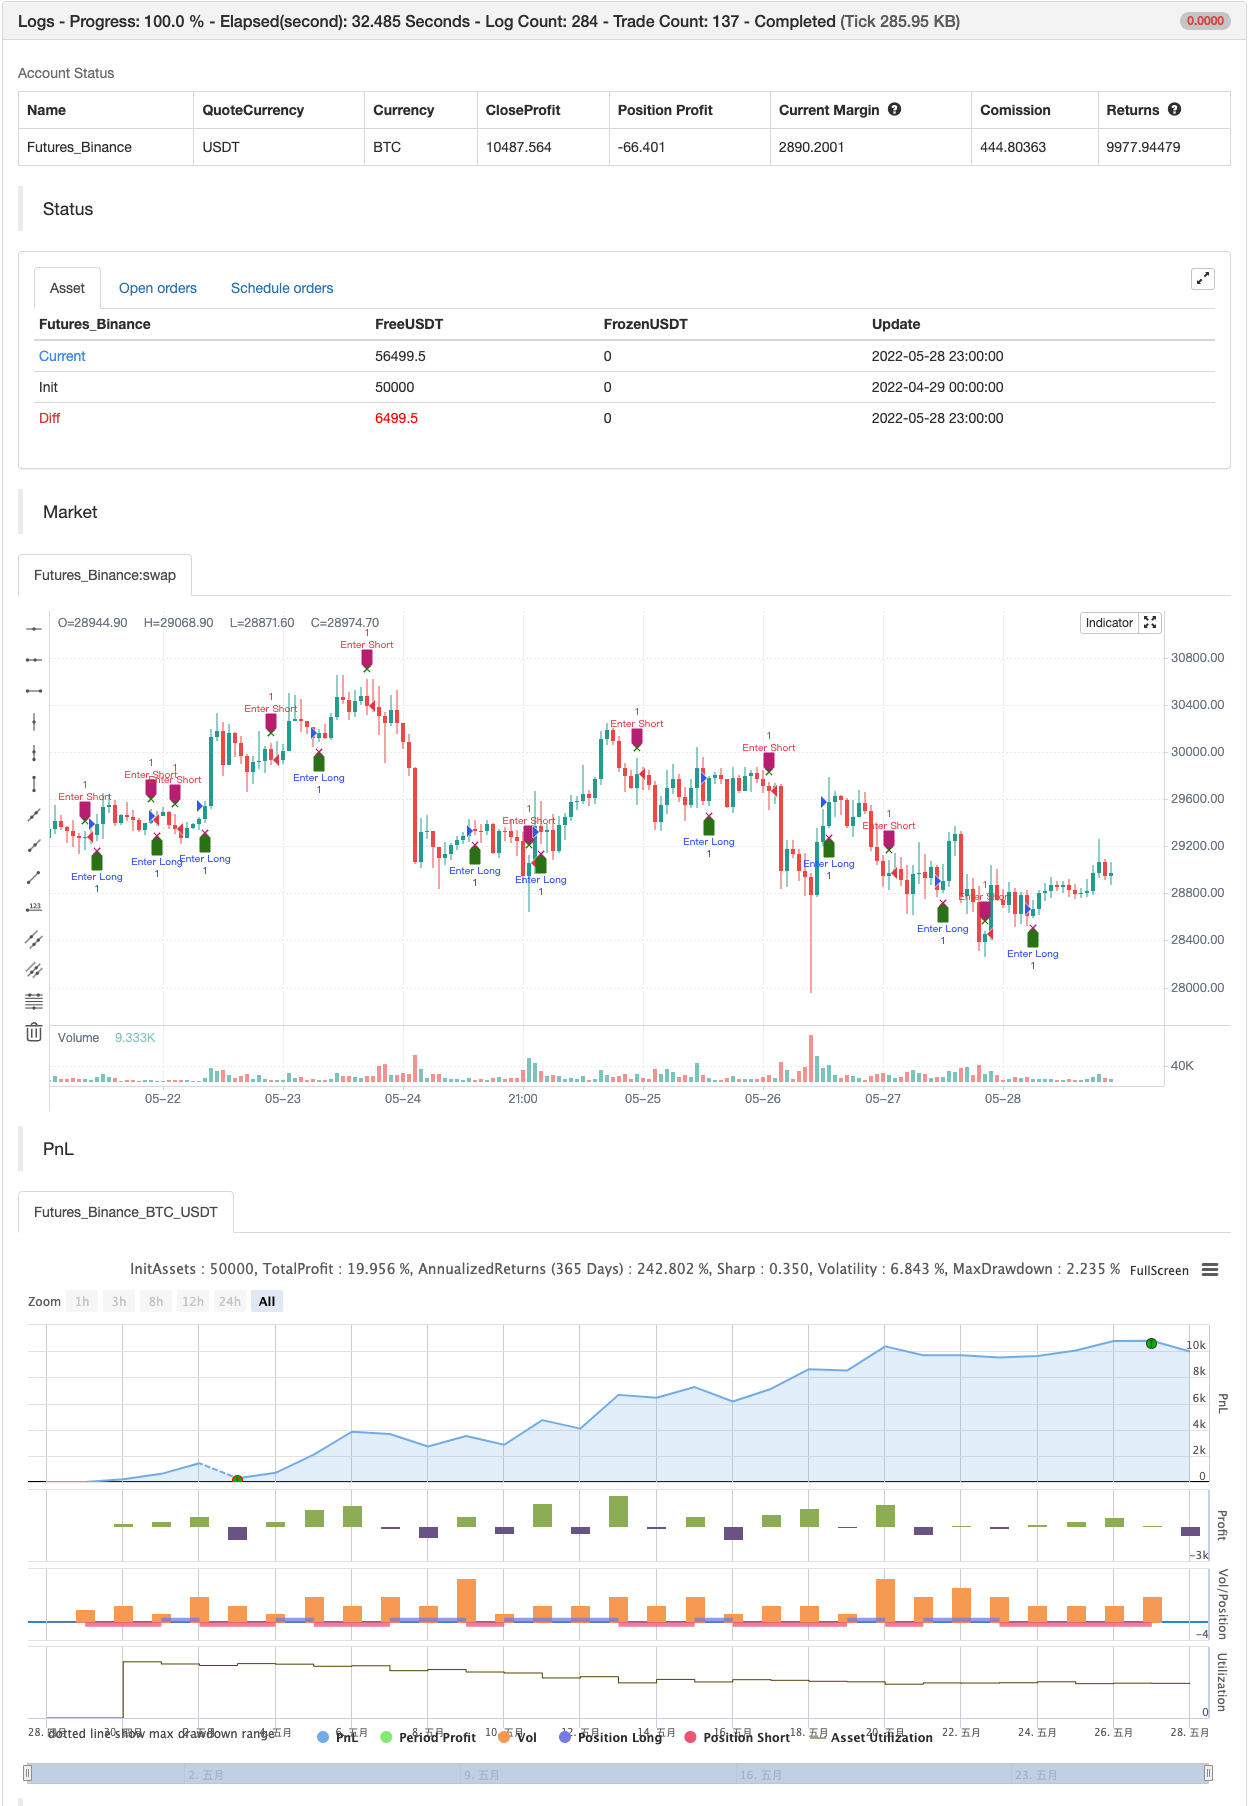
backtest
/*backtest
start: 2022-04-29 00:00:00
end: 2022-05-28 23:59:00
period: 1h
basePeriod: 15m
exchanges: [{"eid":"Futures_Binance","currency":"BTC_USDT"}]
*/

// This source code is subject to the terms of the Mozilla Public License 2.0 at https://mozilla.org/MPL/2.0/
// © tbiktag
//
// Delta-RSI Oscillator Strategy- 1