Pivot Trend

Author: ChaoZhang, Date: 2022-05-31 18:43:20
Tags: 趋势Pivot

Hello Traders,

Another original idea is here with you. Actualy I can say that it’s a breakout strategy that uses multiple Pivot Point’s averages.

How it works?

  • it finds the Pivot Points , you can set the length as you want
  • it gets averages of Pivot Highs and Pivot Lows, you can set the number of Pivot Points to be included
  • it compares the current closing price with averages of Pivot Highs and Pivot Lows
  • if both are positive or negative then trend changes

You have two options:

  • Pivot Point Period => is the length that is used to find Pivot Points . means it checks left/right bars if it’s Pivot Point (4 by default)
  • Number of PP to check => is the number of Pivot Points that the script finds and calculates the averages (3 by default)
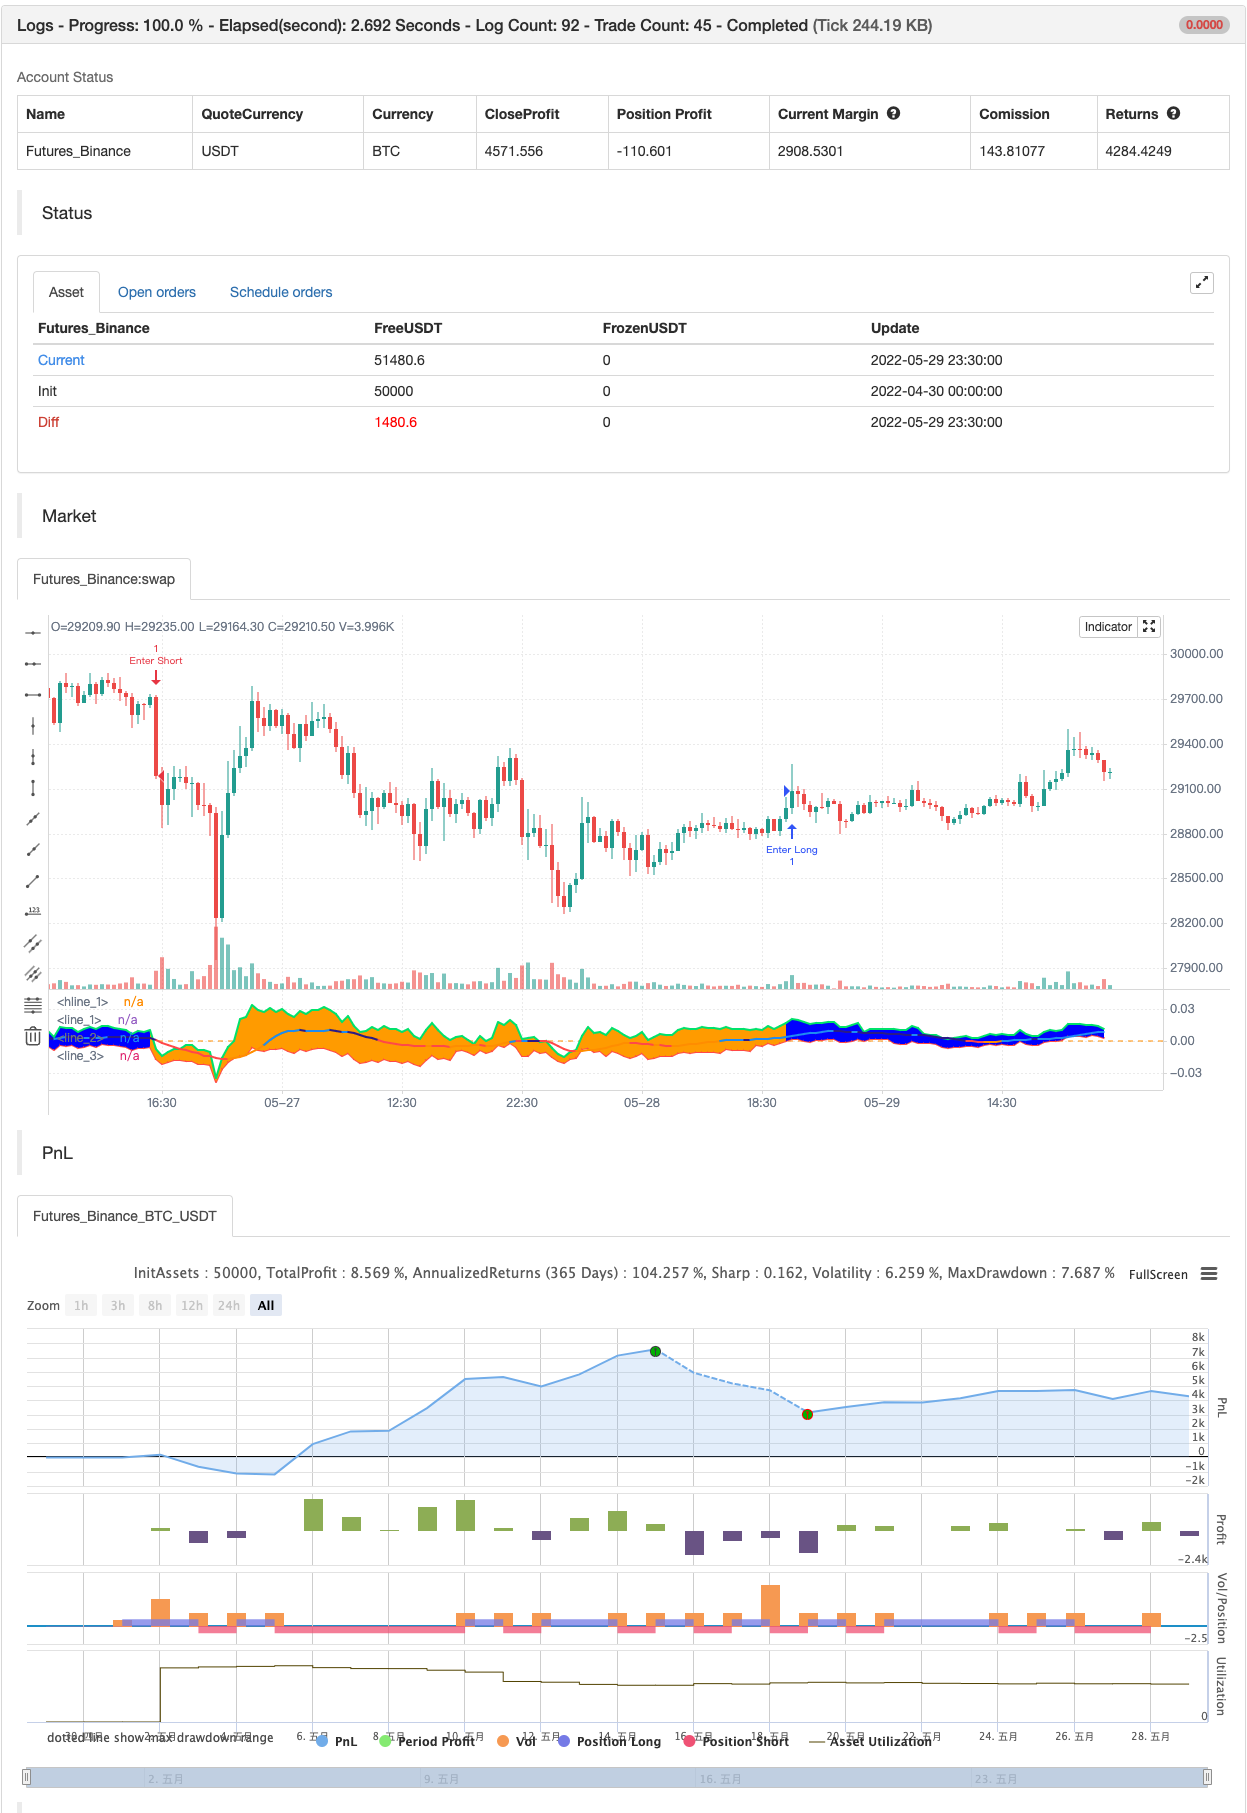
backtest

img


/*backtest
start: 2022-04-30 00:00:00
end: 2022-05-29 23:59:00
period: 30m
basePeriod: 15m
exchanges: [{"eid":"Futures_Binance","currency":"BTC_USDT"}]
*/

// This source code is subject to the terms of the Mozilla Public License 2.0 at https://mozilla.org/MPL/2.0/
// © LonesomeTheBlue

//@version=4
study("Pivot Trend", precision = 2, explicit_plot_zorder = true)
prd = input(defval = 4, title="Pivot Point Period", minval = 1, maxval = 30)
pnum = input(defval = 3, title="number of PP to check", minval = 1, maxval = 30)
colup = input(defval = color.blue, title = "Colors", inline = "col")
coldn = input(defval = color.orange, title = "", inline = "col")

float ph = pivothigh(prd, prd)
float pl = pivotlow(prd, prd)
var ph_lev = array.new_float(pnum, na)
var pl_lev = array.new_float(pnum, na)

if ph
    array.unshift(ph_lev, ph)
    array.pop(ph_lev)
    
if pl
    array.unshift(pl_lev, pl)
    array.pop(pl_lev)
            
float lrate = 0.0
for i = 0 to array.size(pl_lev) - 1
    float rate = (close - array.get(pl_lev, i)) / array.get(pl_lev, i)
    lrate += (rate / pnum)

            
float hrate = 0.0
for i = 1 to array.size(ph_lev) - 1
    float rate = (close - array.get(ph_lev, i)) / array.get(ph_lev, i)
    hrate += (rate / pnum)

hline(0.)
hln = plot(hrate, color = color.red, linewidth = 2)
lln = plot(lrate, color = color.lime, linewidth = 2)

trend = 0
trend := hrate > 0 and lrate > 0 ? 1 : hrate < 0 and lrate < 0 ? -1 : nz(trend[1])
tcolor = trend == 1 ? color.new(colup, 40) : color.new(coldn, 40)
fill(hln, lln, color = tcolor)

mid = sma((hrate + lrate) / 2, 9)
plot(mid, color = mid >= 0 ? mid >= mid[1] ? color.blue : color.navy : mid <= mid[1] ? color.red : color.orange, linewidth = 2)

alertcondition(change(trend) > 0, title='Pivot Trend UP', message='Pivot Trend UP')
alertcondition(change(trend) < 0, title='Pivot Trend DOWN', message='Pivot Trend DOWN')

if change(trend) > 0
    strategy.entry("Enter Long", strategy.long)
else if change(trend) < 0
    strategy.entry("Enter Short", strategy.short)

Related

More