EMA Trend Following Strategy

Overview
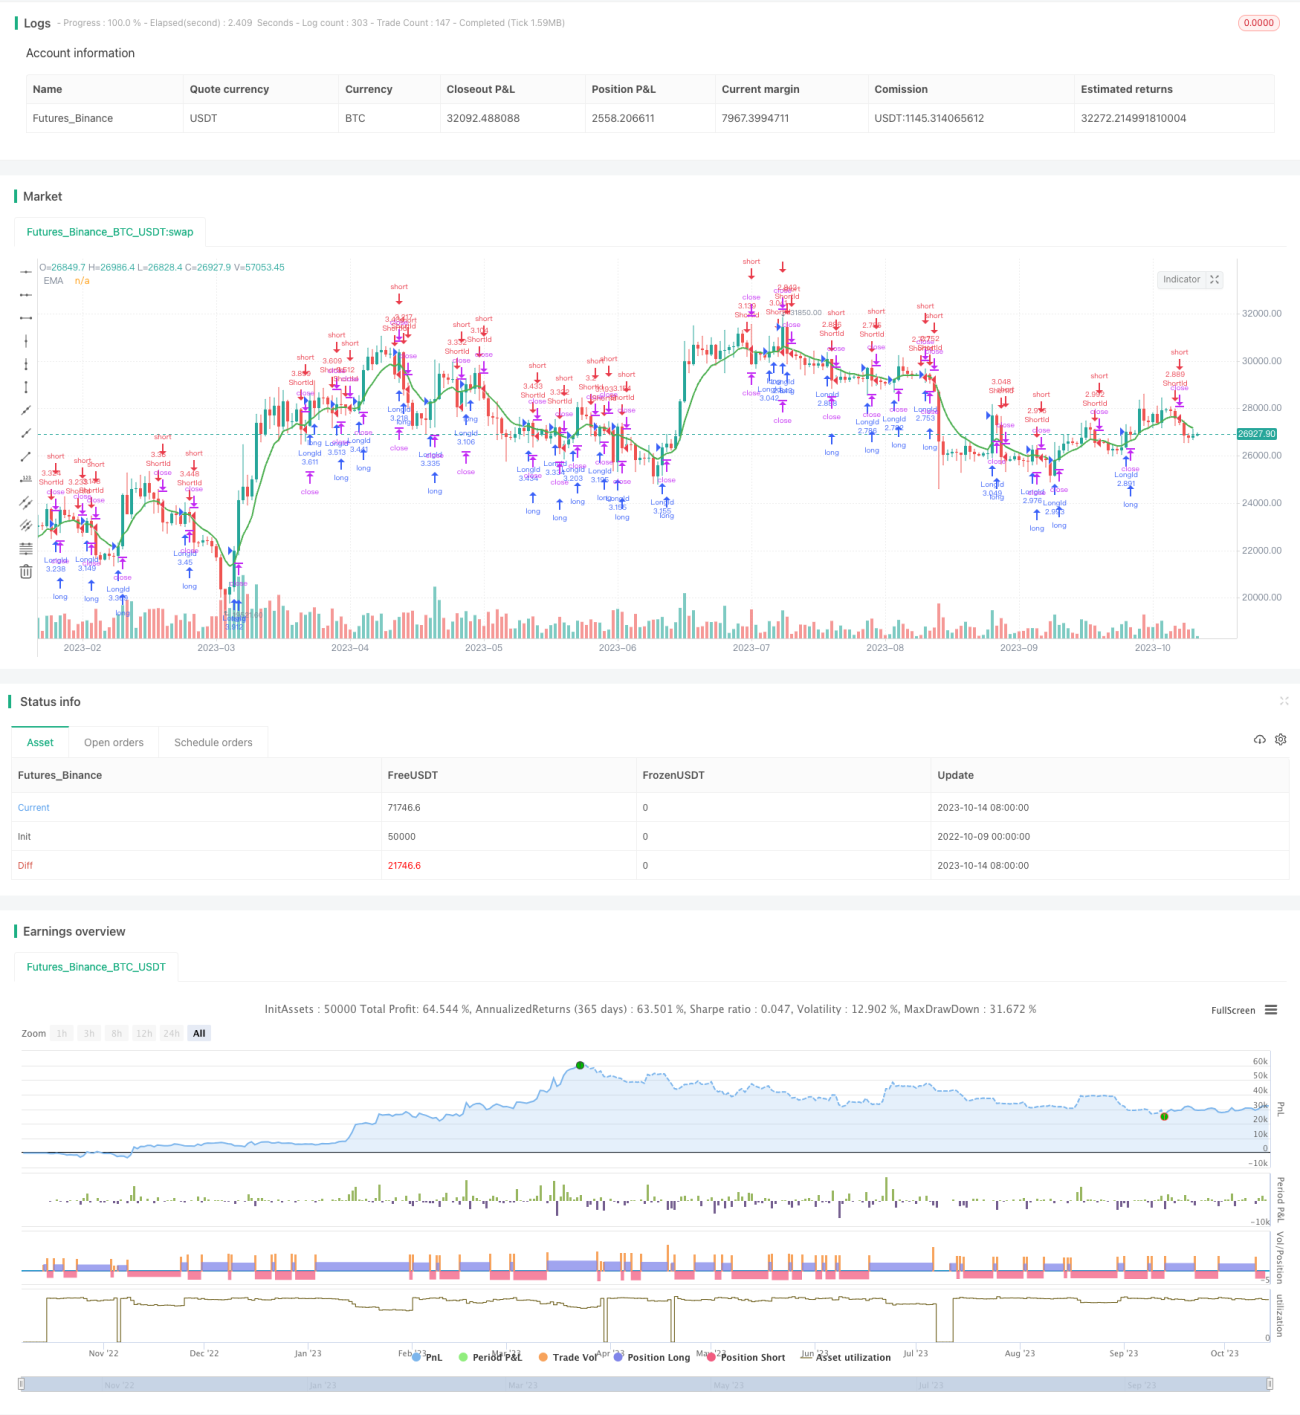
The EMA trend following strategy is a trend tracking strategy based on the EMA indicator. It judges the trend direction by calculating the EMA line of a specified period and follows the trend. It goes short when the price crosses above the EMA line and goes long when the price crosses below the EMA line. This is a typical trend following strategy.
Strategy Logic
The core of this strategy is to determine the trend using the EMA indicator. EMA is an exponential moving average that gives more weight to recent prices and responds faster to price changes. By calculating the average price over an EMA period, it produces a smoothed curve. When the price crosses above the EMA line from below, it signals an upward trend; when the price crosses below the EMA line from above, it signals a downward trend.
Based on this logic, the strategy shorts when price breaks out above the EMA and goes long when the price breaks out below the EMA, tracking the trend by following the EMA line. Specifically, it calculates an 8-period EMA on the closing price - shorting when the close breaks out above EMA and going long when the close breaks out below EMA. It also sets a stop loss to control risks.
Advantages
-
Effective trend following. EMA smoothes price fluctuations, filters out market noise and follows medium to long term trends.
-
Reasonable trading frequency. Compared to shorter-period indicators, EMA has a medium adjustment frequency, avoiding over-trading.
-
Simple to implement. The strategy relies solely on one EMA indicator yet achieves the goal of trend following.
-
Extendibility. The strategy can be enhanced by optimizing EMA parameters or adding other indicators.
Risks and Solutions
-
Missing tuning points. When prices reverse rapidly, EMA needs time to adjust and may miss best entry points. Solution is to combine with indicators that identify tuning points.
-
Increased losses. EMA follows trends and cannot accurately determine tuning points. Reversals may lead to large losses. Solution is to set reasonable stop loss.
-
Frequency too high or too low. Different EMA periods lead to different trading frequencies. Too short may over-trade, too long may miss opportunities. Solution is to test different EMA periods to find the optimal.
Enhancement Suggestions
-
Optimize EMA parameters to find the best balance. Stepwise optimization can determine the optimal EMA period.
-
Add other indicators to determine tuning points. Combine with indicators like RSI to better detect reversals.
-
Optimize stop loss strategy to find the best stop loss level through backtesting.
-
Optimize symbol selection. Adjust EMA periods based on symbol characteristics to achieve best results.
Summary
The EMA trend following strategy is a very typical trend tracking strategy based on an indicator. It is simple and easy to implement, suitable for beginners to learn. Meanwhile, it has extendibility to further improve the strategy by adding indicators or optimizing parameters. With continuous improvements, it can become a very practical trend following tool.
/*backtest
start: 2022-10-09 00:00:00
end: 2023-10-15 00:00:00
period: 1d
basePeriod: 1h
exchanges: [{"eid":"Futures_Binance","currency":"BTC_USDT"}]
*/

//@version=3
strategy(title = "EMA Close Strategy", shorttitle = "EMA Close",calc_on_order_fills=true,calc_on_every_tick =true, initial_capital=21000,commission_value=.25,overlay = true,default_qty_type = strategy.percent_of_equity, default_qty_value = 100)

EmaSource = input(defval = close, title = "EMA Source")- 1