Dynamic ATR Stop Loss Center Line Strategy

Author: ChaoZhang, Date: 2023-10-16 16:20:06
Tags:

img

Overview

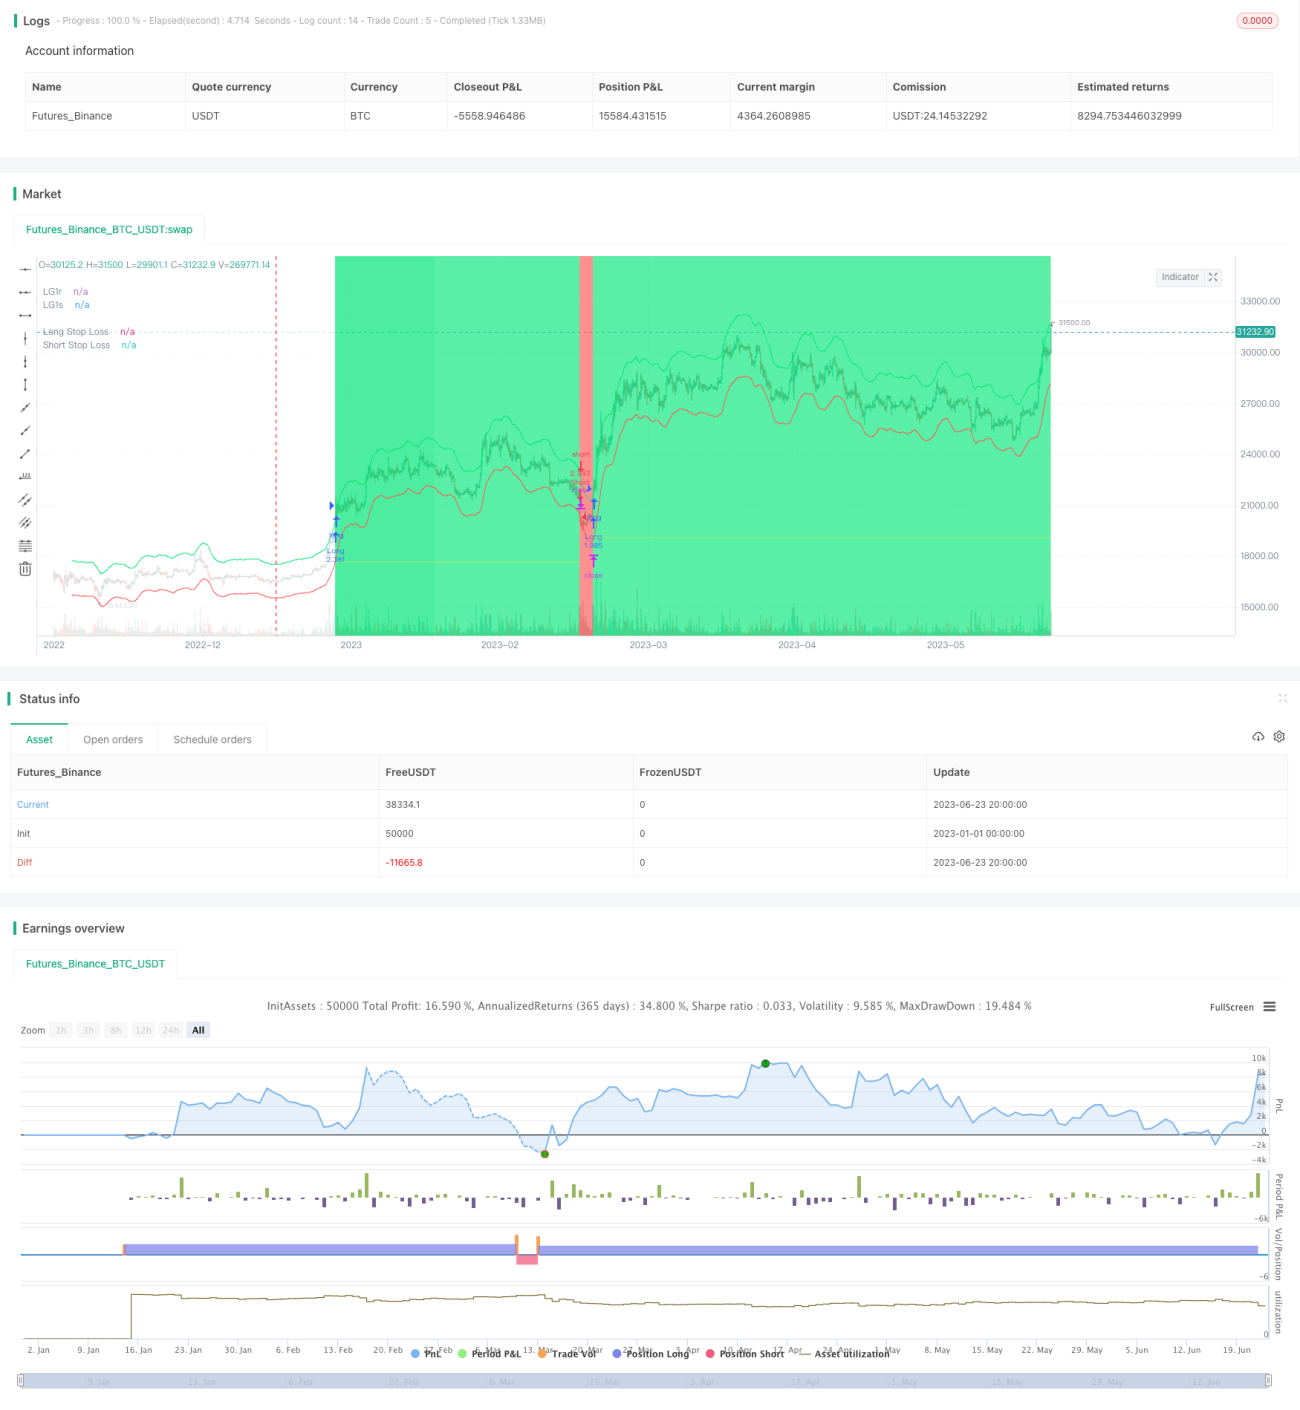
This strategy uses a linear regression function and least squares method to calculate a price channel, consisting of two green and red lines. It employs a dynamic stop loss based on recent ATR.

Strategy Logic

The strategy calculates the center line xLG using linear regression with length 25 and shift 5. Then it takes 6% above and below the center line as channel range, with xLG1r as the upper line and xLG1s as the lower line.

When price is above xLG1r, it goes long. When price is below xLG1s, it goes short. It records the last long and short time. A long signal is generated when the last long time is greater than the last short time. A short signal is generated when the last short time is greater than the last long time.

The dynamic ATR stop loss uses ATR period of 1 and multiplier of 2. For long trades, the stop loss is closing price minus ATR value times multiplier. For short trades, the stop loss is closing price plus ATR value times multiplier.

Advantage Analysis

  • Uses linear regression channel to track long term trends
  • ATR-based stop loss adjusts dynamically to avoid stops being too wide or too tight
  • Price breakout signals help avoid false signals

Risks and Improvements

  • Regression channel parameters need optimization, current range may be too narrow
  • ATR multiplier also needs testing to find optimal parameter
  • Consider adding confirmation on breakout to avoid false breakouts

Optimization Directions

  • Test different regression period lengths to find better parameters
  • Try different ATR periods and stop loss multipliers
  • Add additional confirmation on breakout signals, like volume breakout

Conclusion

This strategy combines multiple techniques like trend following, dynamic stops and breakout signals to create an adaptive trend tracking system. Further enhancements in parameter optimization and signal filtering can improve robustness and profitability. It provides a valuable approach for quant traders.


/*backtest
start: 2023-01-01 00:00:00
end: 2023-06-24 00:00:00
period: 4h
basePeriod: 15m
exchanges: [{"eid":"Futures_Binance","currency":"BTC_USDT"}]
*/

//@version=4
// Thanks to HPotter for the original code for Center of Gravity Backtest
strategy("Center of Gravity BF 🚀", overlay=true, initial_capital=10000, default_qty_type=strategy.percent_of_equity, default_qty_value=100, commission_type=strategy.commission.percent, commission_value=0.15)

/////////////// Time Frame ///////////////
testStartYear = input(2017, "Backtest Start Year") 
testStartMonth = input(1, "Backtest Start Month")
testStartDay = input(1, "Backtest Start Day")
testPeriodStart = timestamp(testStartYear,testStartMonth,testStartDay, 0, 0)

testStopYear = input(2019, "Backtest Stop Year")
testStopMonth = input(12, "Backtest Stop Month")
testStopDay = input(31, "Backtest Stop Day")
testPeriodStop = timestamp(testStopYear,testStopMonth,testStopDay, 0, 0)

testPeriod() => true

///////////// Center of Gravity /////////////
Length = input(25, minval=1)
m = input(5, minval=0)
Percent = input(6, minval=0, title="COG %")

xLG = linreg(close, Length, m)
xLG1r = xLG + ((close * Percent) / 100)
xLG1s = xLG - ((close * Percent) / 100)

pos = 0.0
pos := iff(close > xLG1r, 1, iff(close < xLG1s, -1, nz(pos[1], 0))) 
possig = iff(pos == 1, 1, iff(pos == -1, -1, pos))

/////////////// Srategy ///////////////
long = possig == 1 
short = possig == -1 

last_long = 0.0
last_short = 0.0
last_long := long ? time : nz(last_long[1])
last_short := short ? time : nz(last_short[1])

long_signal = crossover(last_long, last_short)
short_signal = crossover(last_short, last_long)

last_open_long_signal = 0.0
last_open_short_signal = 0.0
last_open_long_signal := long_signal ? open : nz(last_open_long_signal[1])
last_open_short_signal := short_signal ? open : nz(last_open_short_signal[1])

last_long_signal = 0.0
last_short_signal = 0.0
last_long_signal := long_signal ? time : nz(last_long_signal[1])
last_short_signal := short_signal ? time : nz(last_short_signal[1])

in_long_signal = last_long_signal > last_short_signal
in_short_signal = last_short_signal > last_long_signal

last_high = 0.0
last_low = 0.0
last_high := not in_long_signal ? na : in_long_signal and (na(last_high[1]) or high > nz(last_high[1])) ? high : nz(last_high[1])
last_low := not in_short_signal ? na : in_short_signal and (na(last_low[1]) or low < nz(last_low[1])) ? low : nz(last_low[1])

since_longEntry = barssince(last_open_long_signal != last_open_long_signal[1]) 
since_shortEntry = barssince(last_open_short_signal != last_open_short_signal[1]) 

/////////////// Dynamic ATR Stop Losses ///////////////
atrLkb = input(1, minval=1, title='ATR Stop Period')
atrMult = input(2, step=0.25, title='ATR Stop Multiplier') 
atr1 = atr(atrLkb)

longStop = 0.0
longStop :=  short_signal ? na : long_signal ? close - (atr1 * atrMult) : longStop[1]
shortStop = 0.0
shortStop := long_signal ? na : short_signal ? close + (atr1 * atrMult) : shortStop[1]

/////////////// Execution ///////////////
if testPeriod()
    strategy.entry("Long",  strategy.long, when=long)
    strategy.entry("Short", strategy.short, when=short)
    strategy.exit("Long SL", "Long", stop=longStop, when=since_longEntry > 0)
    strategy.exit("Short SL", "Short", stop=shortStop, when=since_shortEntry > 0)

/////////////// Plotting ///////////////
plot(xLG1r, color=color.lime, title="LG1r")
plot(xLG1s, color=color.red, title="LG1s")
plot(strategy.position_size <= 0 ? na : longStop, title="Long Stop Loss", color=color.yellow, style=plot.style_circles, linewidth=1)
plot(strategy.position_size >= 0 ? na : shortStop, title="Short Stop Loss", color=color.orange, style=plot.style_circles, linewidth=1)
bgcolor(strategy.position_size > 0 ? color.lime : strategy.position_size < 0 ? color.red : color.white, transp=90)
bgcolor(long_signal ? color.lime : short_signal ? color.red : na, transp=60)

More