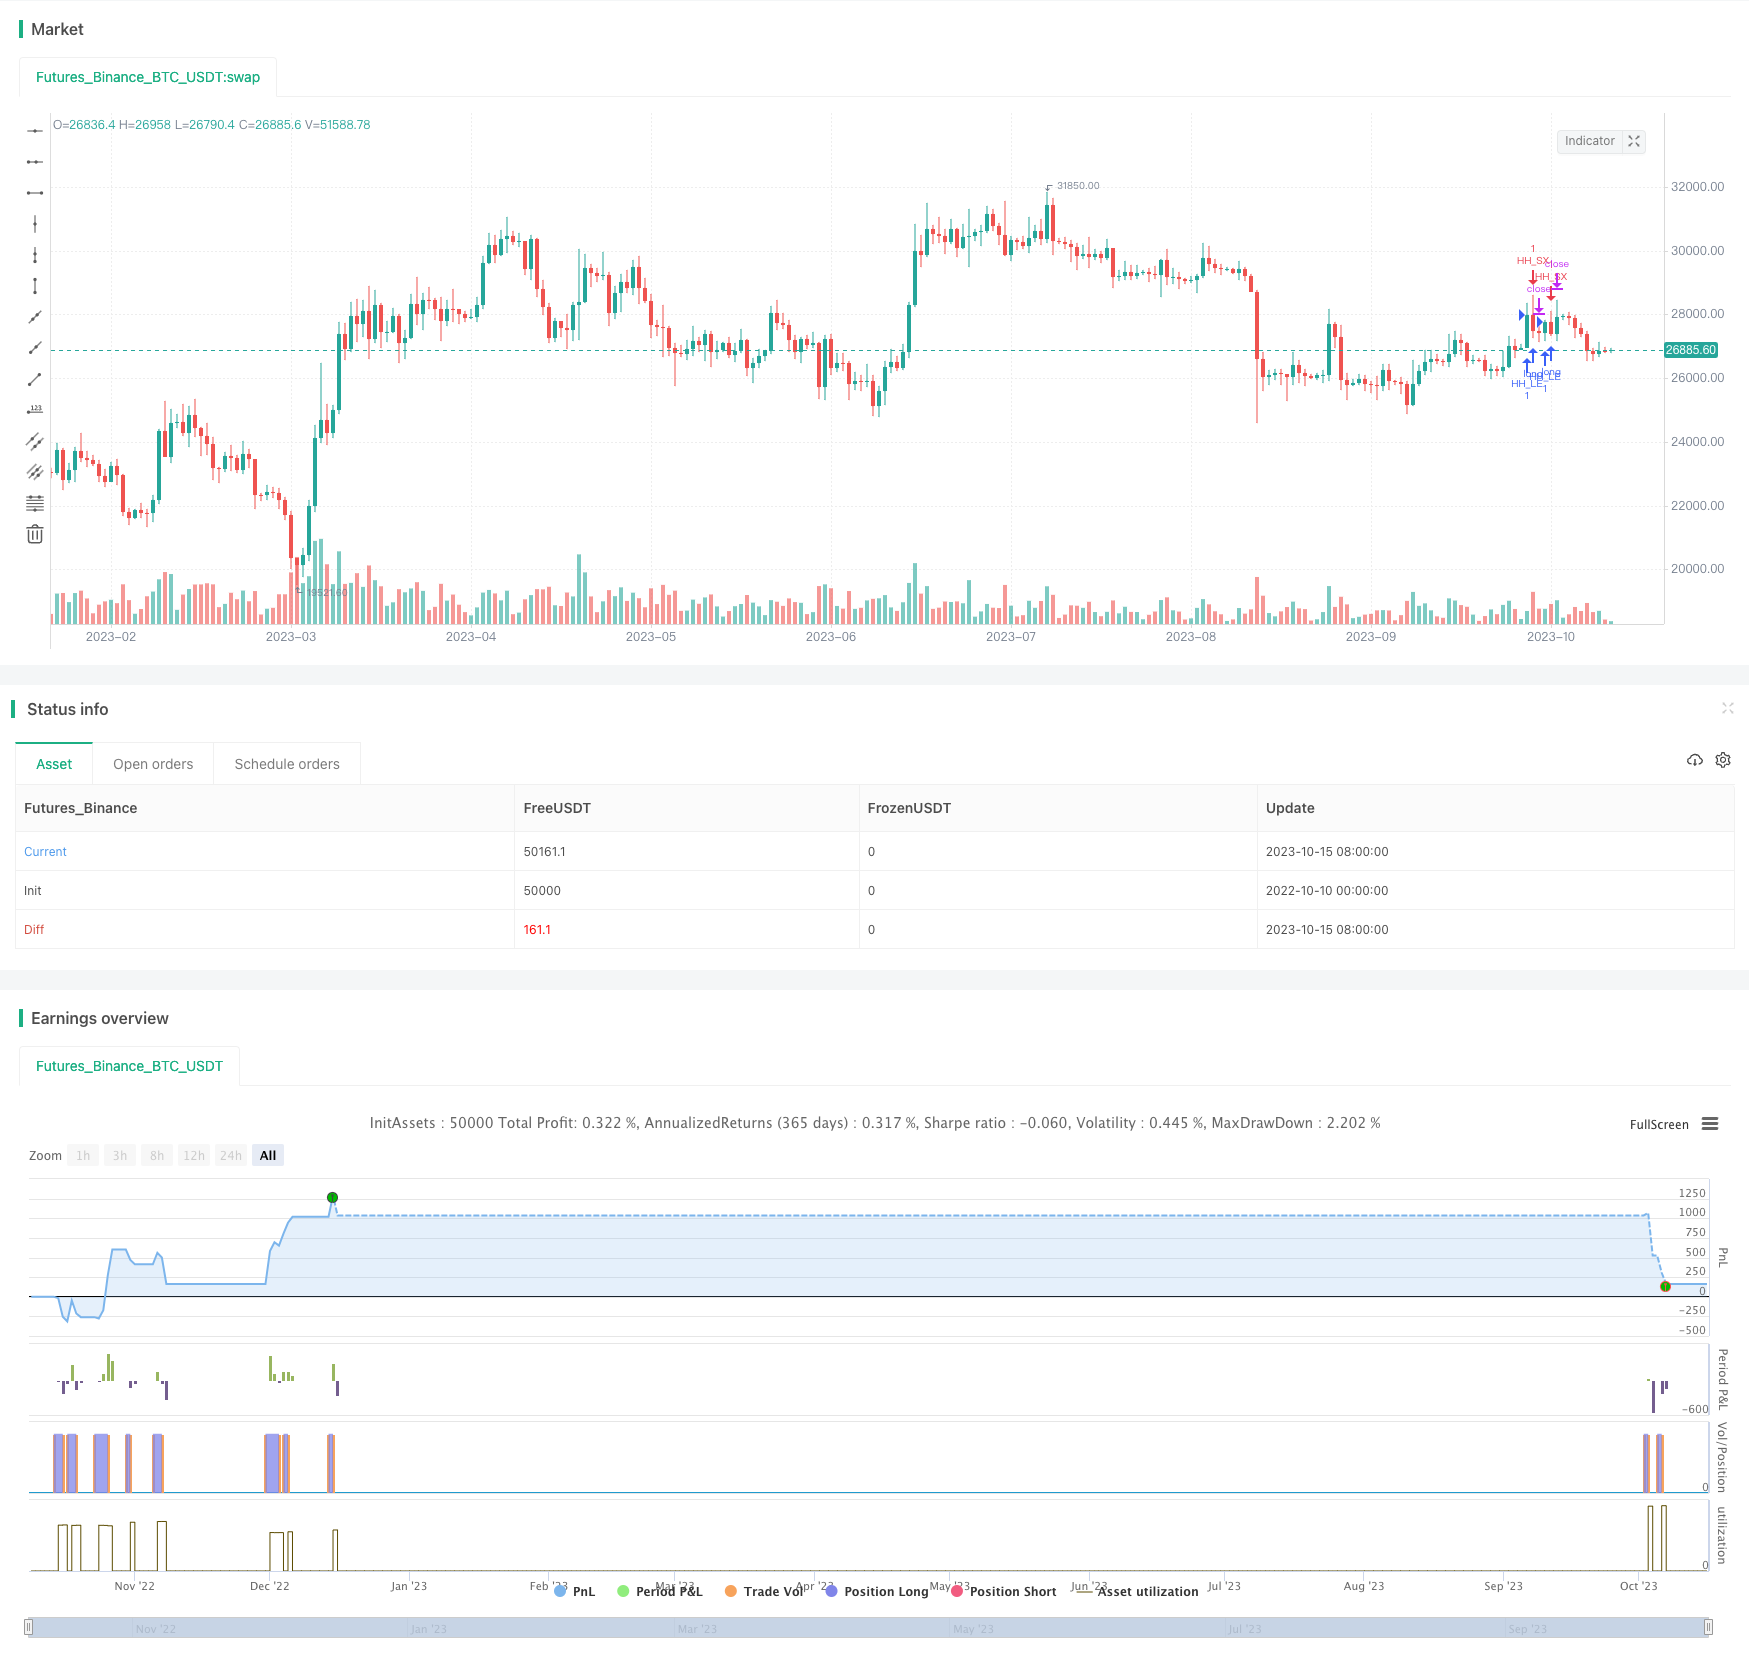
概述
趋势追踪买卖策略是一种简单的趋势跟随日内交易策略。该策略的基本思想是根据移动平均线判断趋势方向,在趋势中的震荡进行买进和卖出。
策略原理
该策略使用简单移动平均线SMA判断趋势方向。在上升趋势中,当K线出现低点时(“回调”),策略会在突破此前K线的最高点时做多;在下跌趋势中,当K线出现高点时(“反弹”),策略会在突破此前K线的最低点时做空。
该策略还利用 Blanchflower意氏指标%K和%D进行趋势判断。当%K上穿%D时平仓做反方向交易。此外,策略还利用MACD和Signal曲线作为过滤条件,只有在MACD和Signal符合趋势方向时才会执行交易。
该策略可以仅做多、仅做空或同时做多做空。起始日期可以设定回测的开始月份和年份。所有参数如移动平均线周期、K周期、D周期、MACD参数等都可以自定义。
优势分析
- 使用移动平均线判断趋势方向可以有效过滤震荡,避免错误交易
- Blanchflower指标的应用可以及时判断趋势反转,以控制风险
- MACD和Signal的过滤减少了不符合趋势方向的noise交易
- 可自定义参数以适应不同品种的价格行为
- 可仅做多、仅做空或双向交易,可以灵活调整适应市场环境
风险分析
该策略主要存在以下风险:
- 大幅突破移动平均线造成巨额亏损的风险。可以适当增大移动平均线周期以降低风险。
- 在震荡趋势中交易频繁造成 overtrading。可以加大%K周期降低交易频率。
- MACD和Signal参数设置不当造成过滤无效。应根据具体品种优化参数。
- 双向交易时多空仓位积累过大造成亏损。应限制仓位规模。
优化方向
该策略可以从以下几个方面进行优化:
- 优化移动平均线周期,在保持对趋势判断的同时尽量过滤震荡
- 优化%K,%D参数,在保持捕捉趋势反转的同时减少whipsaw
- 优化MACD参数,使其过滤效果更好地减少noise交易
- 增加仓位控制,如固定数量开仓、浮动仓位等
- 增加止损策略,如移动止损、时间止损、ATR止损等
总结
趋势追踪买卖策略整体思路清晰简单,通过移动平均线判断趋势方向,并利用指标过滤以锁定趋势中的交易机会。该策略可以通过参数优化得到不错的效果,但仍需要Combine代码封装以减少过优化风险并提高稳定性。此外,适当优化以控制风险也很重要。总体来说,该策略作为日内交易策略还是比较实用的。
策略源码
/*backtest
start: 2022-10-10 00:00:00
end: 2023-10-16 00:00:00
period: 1d
basePeriod: 1h
exchanges: [{"eid":"Futures_Binance","currency":"BTC_USDT"}]
*/

//@version=4
strategy("Higher High / Lower Low Strategy", overlay=true)

// Getting inputs
longOnly = input(true, title="Long or Short Only")
useMACD = input(true, title="Use MACD Filter")
useSignal = input(true, title="Use Signal Filter")
//Filter backtest month and year
startMonth = input(10, minval=1, maxval=12, title="Month")
startYear = input(2020, minval=2000, maxval=2100, title="Year")
//Filter funtion inputs
periodA = input(20, minval=1, title="Period SMA")
periodK = input(5, minval=1, title="Period %K")
fast_length = input(title="Period Fast", type=input.integer, defval=5)
slow_length = input(title="Period Slow", type=input.integer, defval=20)
signal_length = input(title="Signal Smoothing", type=input.integer, minval = 1, maxval = 50, defval = 30)

//Calculations
smoothD = 3 //input(3, minval=1, title="Smooth %D")
smoothK = 2 //input(2, minval=1, title="Smooth %K")
ma50 = sma(close, periodA)
k = sma(stoch(close, high, low, periodK), smoothK) - 50
d = sma(k, smoothD)
macd = ema(close,fast_length) - ema(close,slow_length)
signal = ema(macd,signal_length)
hist = macd - signal

if (not na(k) and not na(d) and not na(macd) and not na(signal) and longOnly and month>=startMonth and year>=startYear)//	if(k > k[1] and k[2] >= k[1] and (ma50 > ma50[1]) and (not useK or k[1] <= -threshold_k) and (not useMACD or macd > macd[1]) and (not useSignal or signal > signal[1]) and (not useHHLL or close >= high[1]) and (not useD or d <= -threshold_d))
    if(high[2] >= high[1] and high > high[1] and (ma50 > ma50[1]) and (not useMACD or macd > macd[1]) and (not useSignal or signal > signal[1]))
		strategy.order("HH_LE", strategy.long, when=strategy.position_size == 0, comment="HH_LE")
    if (k < k[1])
		strategy.order("HH_SX", strategy.short, when=strategy.position_size != 0, comment="HH_SX")

if (not na(k) and not na(d) and not na(macd) and not na(signal) and not longOnly and month>=startMonth and year>=startYear)
    if(low[2] <= low[1] and low < low[1] and (ma50 < ma50[1]) and (not useMACD or macd < macd[1]) and (not useSignal or signal < signal[1]))
		strategy.order("HH_SE", strategy.short, when=strategy.position_size == 0, comment="HH_SE")
    if (k > k[1])
		strategy.order("HH_LX", strategy.long, when=strategy.position_size != 0, comment="HH_LX")

//plot(strategy.equity, title="equity", color=color.red, linewidth=2, style=plot.style_areabr)