Short-Mid Term Trend Following Strategy Based on SMA Indicators

Overview
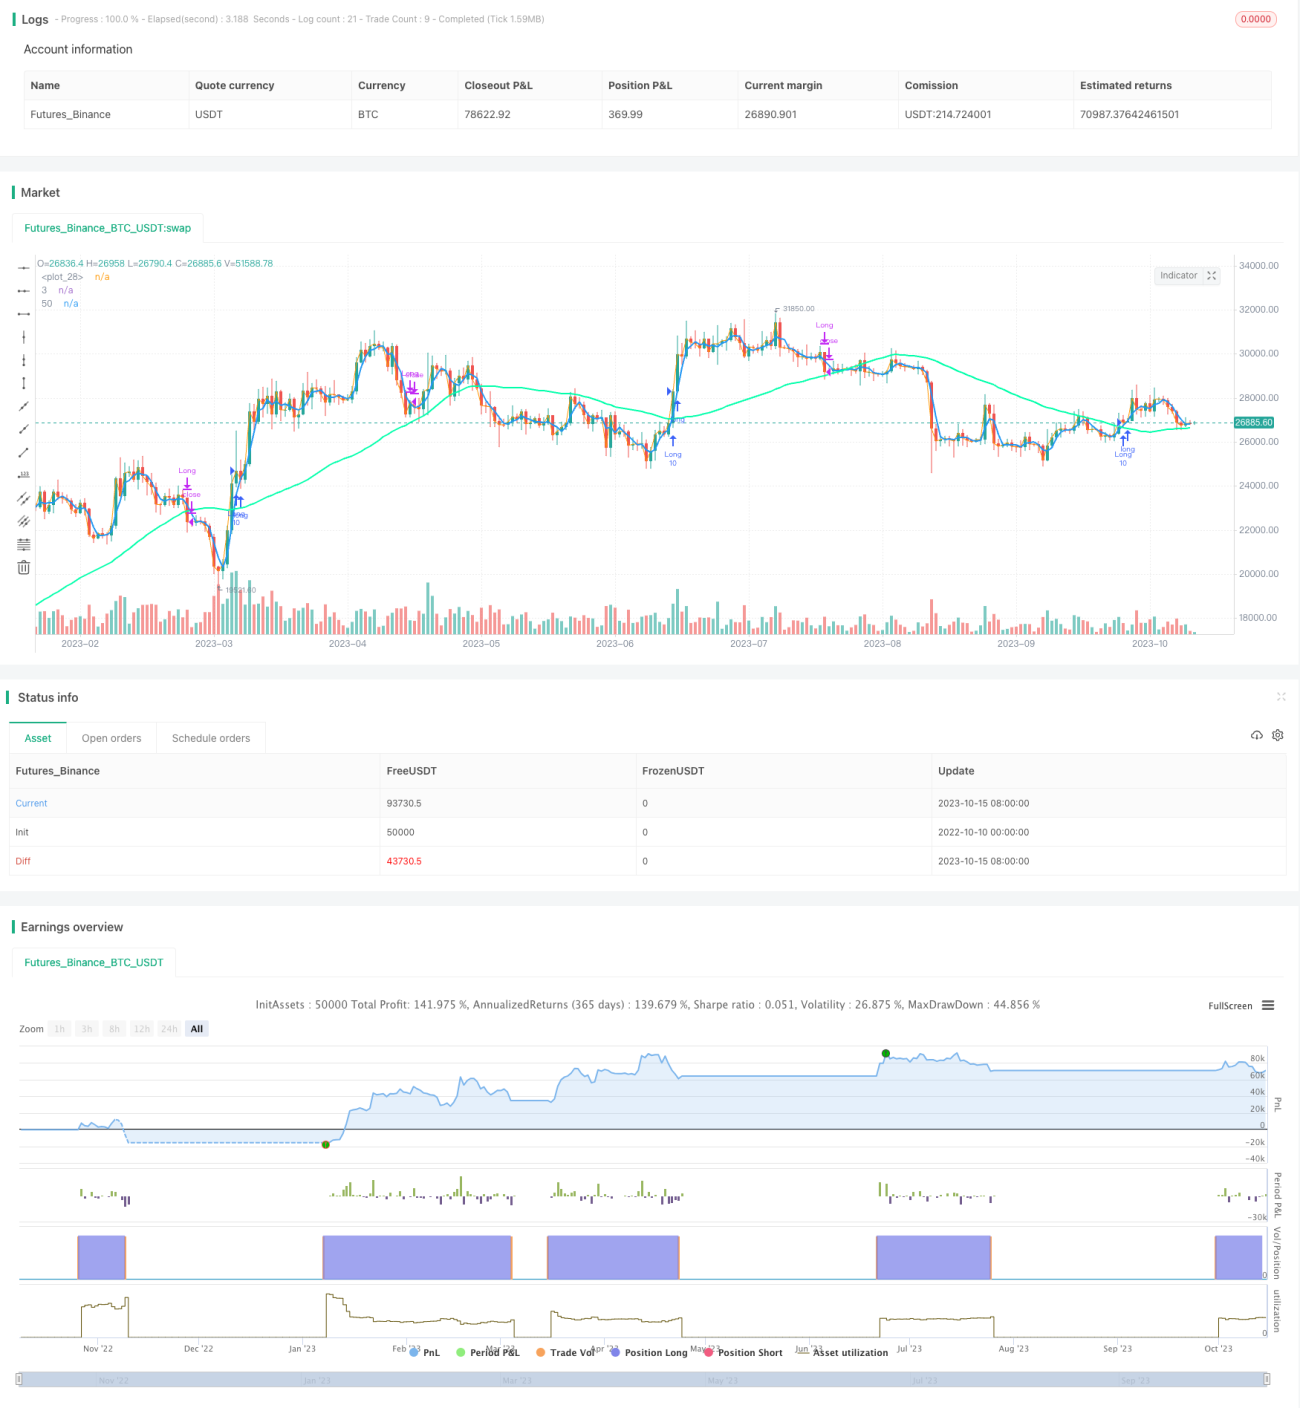
The moving average crossover strategy is a trend following strategy that uses the crossover of different period moving averages to determine market trend direction and generate buy and sell signals. This strategy uses the crossover of 3-period and 50-period simple moving averages (SMA) to make judgments. When the short-term SMA crosses above the long-term SMA, it is considered a bullish signal to buy. When the short-term SMA crosses below the long-term SMA, it is considered a bearish signal to sell.
Strategy Logic
This strategy calculates the 3-period and 50-period simple moving averages. When the 3-day SMA crosses above the 50-day SMA, it indicates the short-term trend has turned bullish and a buy signal is generated. When the 3-day SMA crosses below the 50-day SMA, it indicates the short-term trend has turned bearish and a sell signal is generated. To reduce unnecessary trading, a 40-day median SMA is also added. If the 3-day SMA crosses below the 40-day SMA, a sell signal is also triggered for a quick stop loss.
The key to this strategy is using moving averages of different periods to divide market fluctuations into different stages. The 3-day SMA represents the shortest-term trend, the 50-day SMA represents the medium-term trend, and their crossover represents the conversion of short-term and medium-term trends, which can capture price changes across different time horizons. Through this multi-timeframe analysis, it can judge turning points in the market quite accurately.
Advantage Analysis
-
Clear momentum crossover and explicit signals. Crossover of different period SMAs can effectively determine changes in short-term and medium-term trends, avoiding interference from minor market fluctuations.
-
Quick stop loss by SMA3 crossing below SMA40 reduces losses and controls risks.
-
Simple and clear strategy logic, easy to implement. Indicators and signal rules are directly actionable.
-
Flexibility to adjust SMA parameters for different market conditions and trading instruments.
-
Can incorporate other technical or fundamental indicators for combo validation to avoid false signals.
Risk Analysis
-
Frequent SMA crossover signals may lead to overtrading in sideways or non-trending markets, increasing costs.
-
SMA has lagging nature, signals may come after price has already moved substantially from ideal levels.
-
Fixed SMA parameters may not suit all market conditions, optimization needed.
-
Reliance on single indicator makes strategy vulnerable to failure.
Improvement Directions
-
Optimize SMA periods to find best parameter combinations.
-
Add oscillators like stochastic, MACD to validate signals and avoid false signals.
-
Adjust position sizing and stop loss based on changing market conditions.
-
Consider adding fundamental indicators like earnings, news.
-
Use volume indicators, enter on high volume breakouts.
Conclusion
The moving average crossover strategy judges changes in short-term and medium-term trends by crossing over different period SMAs, and takes trend following actions. It is a simple and direct trend following strategy. The advantages are its clear logic and ease of implementation. Performance can be enhanced through parameter optimization and combo validation. However, SMAs themselves have lagging nature and cannot precisely catch turns. It is recommended to combine with leading indicators and use for trend following in major trends.
- 1