Adaptive Volatility Finite Volume Elements Strategy

Overview
This strategy utilizes the finite volume element method combined with adaptive volatility metrics to determine long and short signals, belonging to the trend following strategies. It is applicable to all timeframes and can automatically adjust parameters to adapt to different volatility levels.
Principles
The strategy first calculates the average of high and low prices, average of close prices of recent N bars, and average high, low and close prices of the previous bar. Then it computes the logarithmic returns Intra and Inter for the current and previous bar. Meanwhile, it calculates the volatilities Vintra and Vinter of Intra and Inter.
Based on the volatility levels and adjustable parameters, the adaptive cutoff coefficient CutOff is determined. When price change exceeds the CutOff, long or short signals are generated. Specifically, it calculates the difference MF between current close price and average of high & low prices. When MF is greater than CutOff, it's a long signal. When MF is less than negative CutOff, it's a short signal.
Finally according to the signals, fund flows are calculated, outputting the position signal pos, and plotting the Finite Volume Element curve FVE.
Advantages
-
Adaptive parameters, applicable to different timeframes and volatility levels without manual adjustment.
-
Accurately captures trend changes of the prices.
-
The FVE curve clearly reflects the comparison of long and short forces.
-
Solid theoretical basis of fund flow analysis, relatively reliable signals.
Risks
-
May generate more false signals during violent market fluctuation. Can adjust N accordingly.
-
Unable to handle price gaps. Can consider combining other indicators.
-
Fund flow signals may diverge from technical analysis sometimes. Can combine multiple signals.
Optimization
-
Can test the impact of different N values. Generally larger N can filter out noise.
-
Can test different combinations of Cintra and Cinter to find optimal parameters. Or consider adapting them dynamically.
-
Can combine with other indicators like MACD to improve robustness.
-
Can build in stop loss mechanisms to control single trade loss.
Conclusion
Overall this strategy is quite reliable with solid principles. It can serve as a component of trend following strategies, and work even better when combined properly with others. The key is to find optimal parameters and establish sound risk management. If further optimized, it can become a very powerful trend following system.
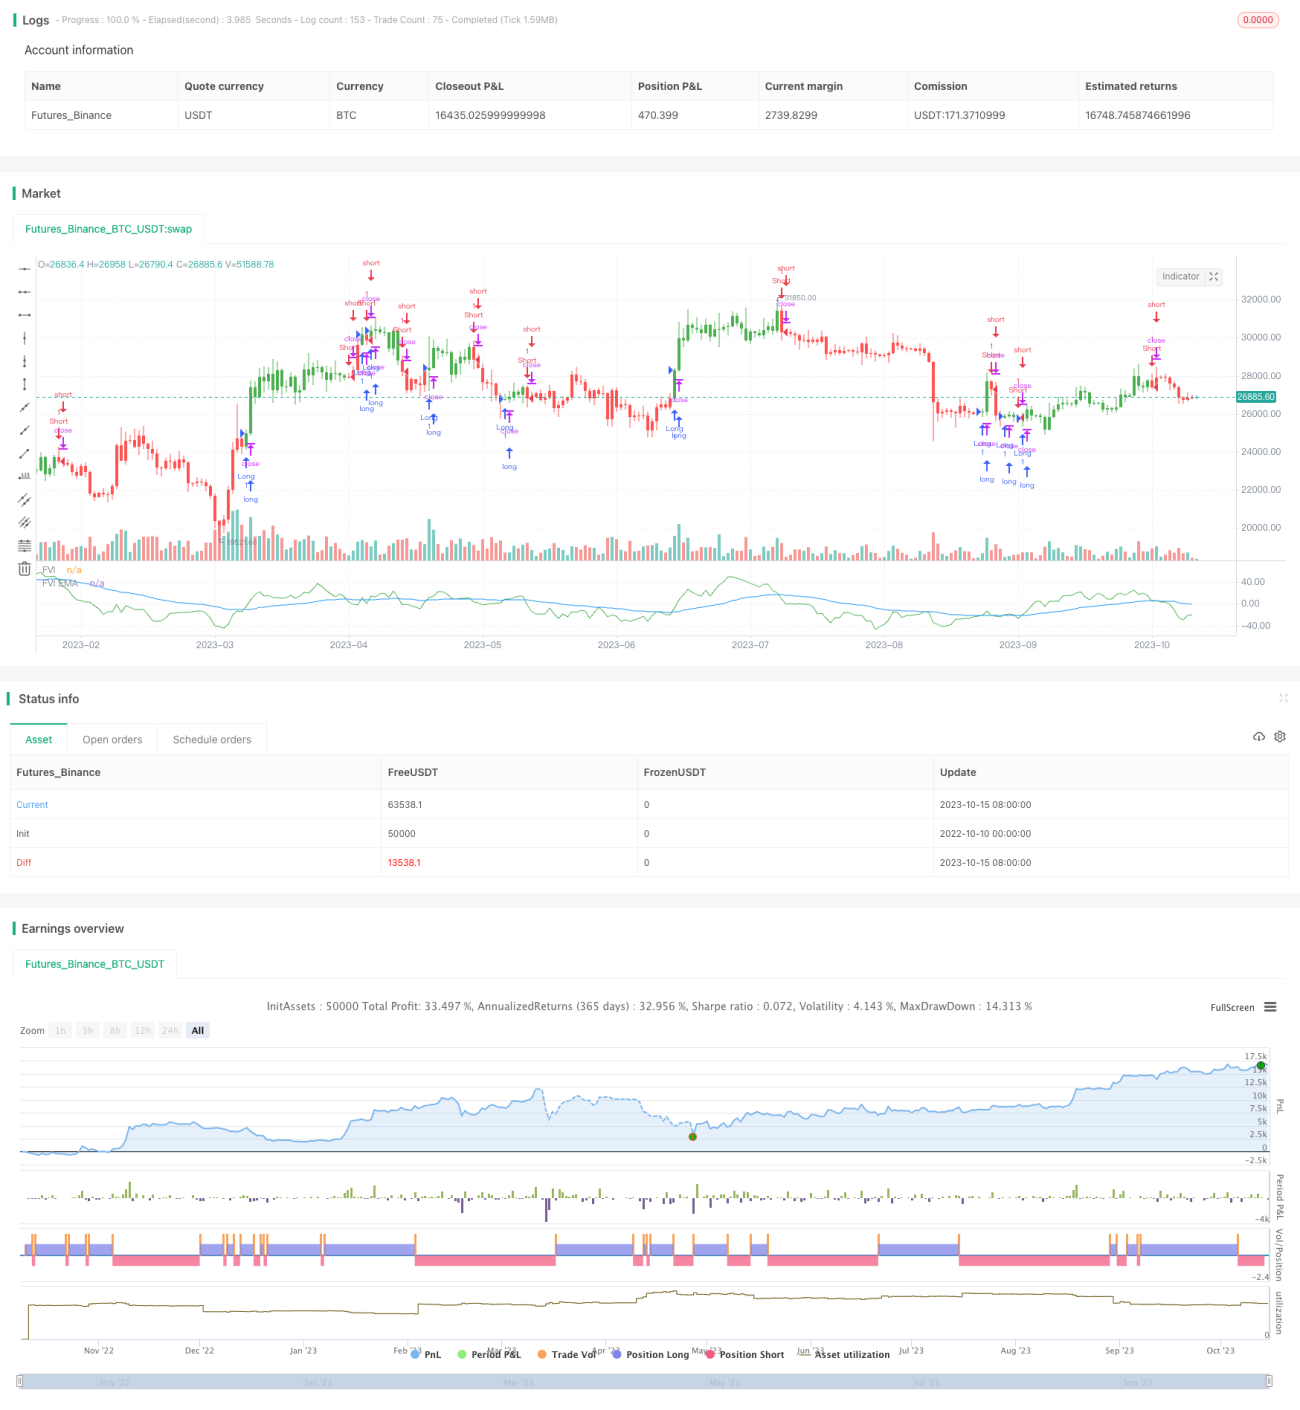
/*backtest
start: 2022-10-10 00:00:00
end: 2023-10-16 00:00:00
period: 1d
basePeriod: 1h
exchanges: [{"eid":"Futures_Binance","currency":"BTC_USDT"}]
*/

//@version=2
////////////////////////////////////////////////////////////
//  Copyright by HPotter v1.0 18/08/2017
// This is another version of FVE indicator that we have posted earlier - 1