Algorithm RSI Range Breakout Strategy

Author: ChaoZhang, Date: 2023-10-17 17:14:09
Tags:

img

Overview

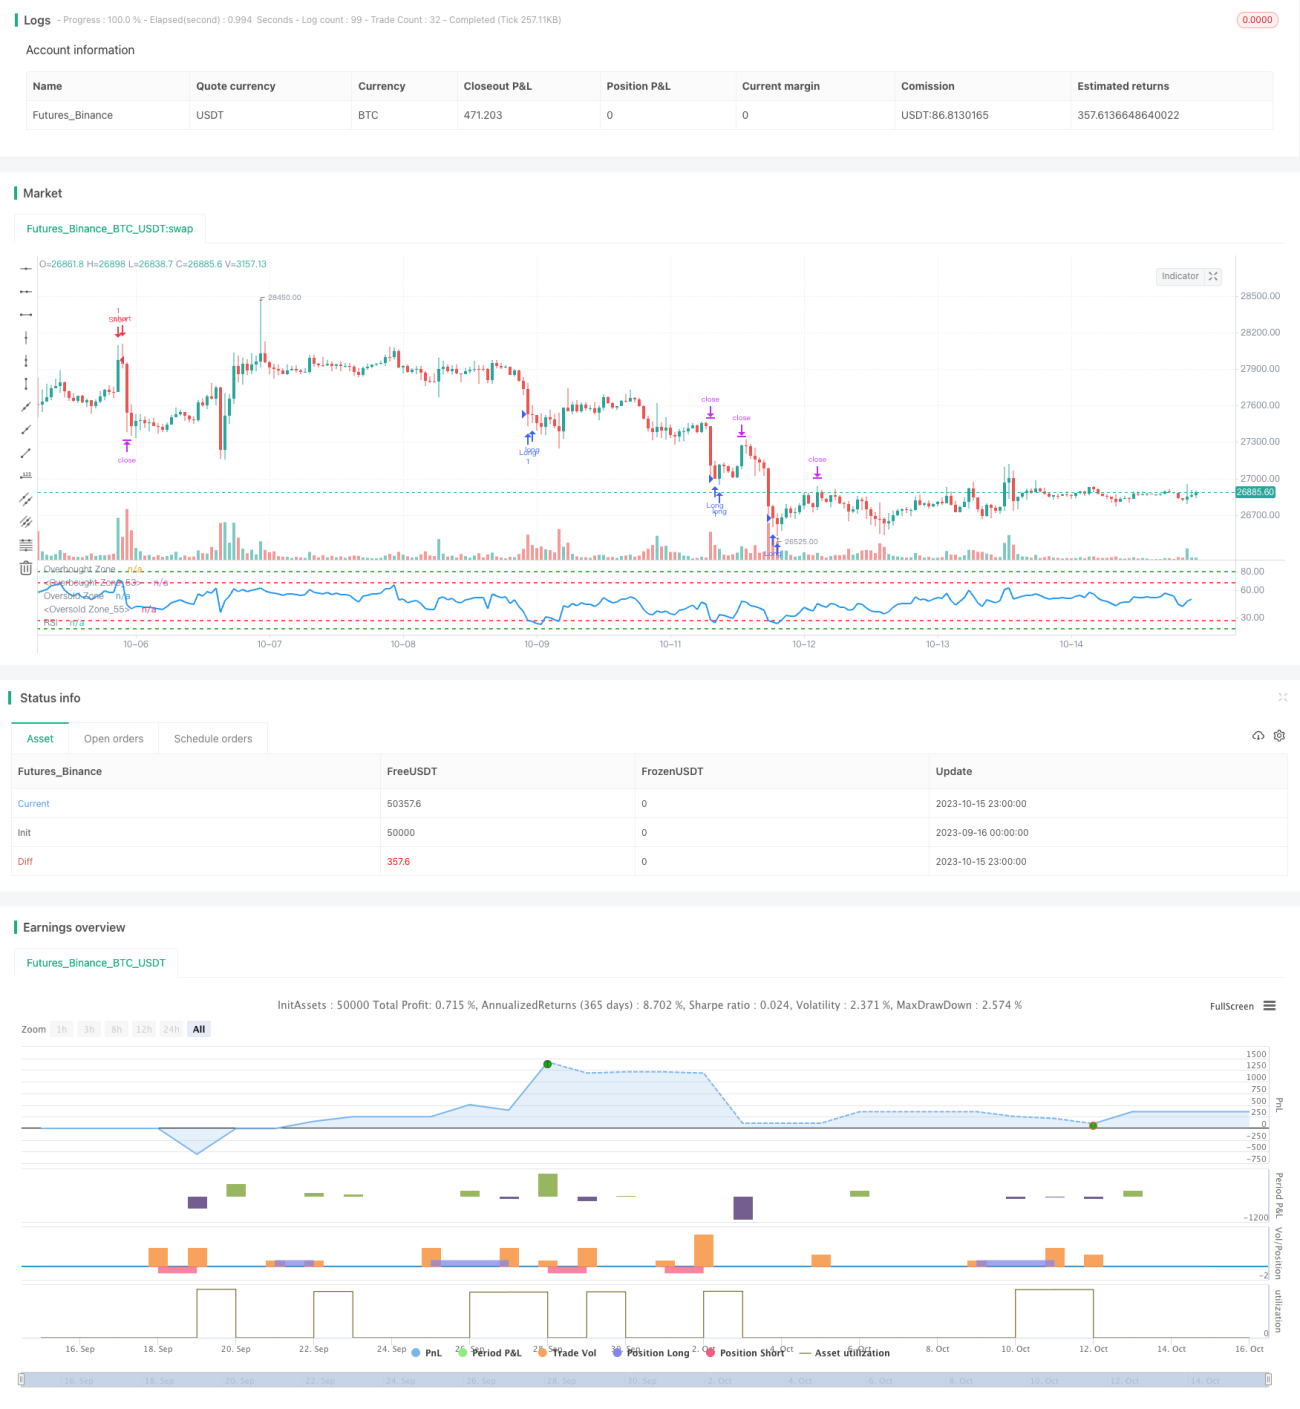
This strategy monitors the breakout of RSI indicator in different ranges to implement buying low and selling high. It goes long when RSI is in the low range and goes short when RSI is in the high range, thus reversing position when overbought or oversold conditions appear.

Strategy Logic

  1. Set RSI period to 14

  2. Set RSI buy signal ranges:

    • Range 1: RSI <= 27
    • Range 2: RSI <= 18
  3. Set RSI sell signal ranges:

    • Range 1: RSI >= 68
    • Range 2: RSI >= 80
  4. When RSI enters buy range, go long:

    • If RSI enters range 1 (below 27), go long 1 lot
    • If RSI enters range 2 (below 18), go additional long 1 lot
  5. When RSI enters sell range, go short:

    • If RSI enters range 1 (above 68), go short 1 lot
    • If RSI enters range 2 (above 80), go additional short 1 lot
  6. Set fixed take profit to 2500 pips and stop loss to 5000 pips

  7. Close position when RSI exits signal range

Advantage Analysis

  1. The double range setting helps better identify overbought and oversold conditions, avoiding missing reversal opportunities

  2. Adopting fixed take profit and stop loss in pips prevents chasing trends too much

  3. RSI is a mature oscillator in identifying overbought and oversold levels with advantages over other indicators

  4. With proper parameter tuning, this strategy can effectively catch trend reversal points and generate excess returns

Risk Analysis

  1. RSI divergence may happen leading to consecutive losses from sustained short position

  2. Fixed take profit and stop loss may not match market volatility, unable to profit or stopping out prematurely

  3. Improper range setting may lead to missing trades or frequent unprofitable trades

  4. This strategy relies much on parameter optimization based on backtests. Careful walk-forward analysis is needed.

Optimization Directions

  1. Test effectiveness of RSI with different period lengths

  2. Optimize buy and sell range values to fit characteristics of different products

  3. Research dynamic take profit and stop loss to improve profitability and reasonability

  4. Consider combining other indicators for ensemble trading to improve robustness

  5. Explore machine learning techniques to auto-optimize parameter ranges for robustness

Conclusion

This strategy is based on RSI’s overbought and oversold principles. By adopting double trading ranges, it utilizes RSI indicator effectively, capturing market extremes with decent stability. However, it has some parameter reliance and needs optimization across products. If tuned properly, this strategy can yield good excess returns. In summary, it is a simple yet effective trading strategy using a mature indicator, worth researching for improvements and providing insights for quantitative trading.


/*backtest
start: 2023-09-16 00:00:00
end: 2023-10-16 00:00:00
period: 1h
basePeriod: 15m
exchanges: [{"eid":"Futures_Binance","currency":"BTC_USDT"}]
*/

// This source code is subject to the terms of the Mozilla Public License 2.0 at https://mozilla.org/MPL/2.0/
// © Rawadabdo

// Ramy's Algorithm

//@version=5
strategy("BTC/USD - RSI", overlay=false, initial_capital = 5000)

// User input
length = input(title = "Length", defval=14, tooltip="RSI period")

first_buy_level = input(title = "Buy Level 1", defval=27, tooltip="Level where 1st buy triggers")
second_buy_level = input(title = "Buy Level 2", defval=18, tooltip="Level where 2nd buy triggers")

first_sell_level = input(title = "Sell Level 1", defval=68, tooltip="Level where 1st sell triggers")
second_sell_level = input(title = "Sell Level 2", defval=80, tooltip="Level where 2nd sell triggers")

takeProfit= input(title="target Pips", defval=2500, tooltip="Fixed pip stop loss distance")
stopLoss = input(title="Stop Pips", defval=5000, tooltip="Fixed pip stop loss distance")

lot = input(title = "Lot Size", defval = 1, tooltip="Trading Lot size")

// Get RSI
vrsi = ta.rsi(close, length)

// Entry Conditions
long1 = (vrsi <= first_buy_level and vrsi>second_buy_level)
long2 = (vrsi <= second_buy_level)

short1= (vrsi >= first_sell_level and vrsi<second_sell_level)
short2= (vrsi >= second_sell_level)


// Entry Orders
// Buy Orders
if (long1 and strategy.position_size == 0)
    strategy.entry("Long", strategy.long, qty=lot, comment="Buy")
    if (long2 and  strategy.position_size == 0)
        strategy.entry("Long", strategy.long, qty=lot, comment="Buy")

// Short Orders
if (short1 and strategy.position_size == 0)
    strategy.entry("Short", strategy.short,qty=lot, comment="Sell")
    if (short2 and strategy.position_size == 0)
        strategy.entry("Short", strategy.short,qty=lot, comment="Sell")
    
// Exit our trade if our stop loss or take profit is hit
strategy.exit(id="Long Exit", from_entry="Long",qty = lot, profit=takeProfit, loss=stopLoss)
strategy.exit(id="Short Exit", from_entry="Short", qty = lot, profit=takeProfit, loss=stopLoss)

// plot data to the chart
hline(first_sell_level, "Overbought Zone", color=color.red, linestyle=hline.style_dashed, linewidth = 2)
hline(second_sell_level, "Overbought Zone", color=color.green, linestyle=hline.style_dashed, linewidth = 2)
hline(first_buy_level, "Oversold Zone", color=color.red, linestyle=hline.style_dashed, linewidth = 2)
hline(second_buy_level, "Oversold Zone", color=color.green, linestyle=hline.style_dashed, linewidth = 2)
plot (vrsi, title = "RSI", color = color.blue, linewidth=2)


More