Breakout Strategy Based on Turtle Trading

Overview
This strategy is based on the famous Turtle Trading system, using Donchian Channel to identify breakouts and ATR to set stop loss for trend following. The advantage is strong drawdown control ability by effectively limiting single trade loss. However, adaptiveness across different trading instruments is weak and needs parameter tuning. Overall, as an introductory version of Turtle Trading system, this strategy can be used to validate the effectiveness of Turtle Trading rules and also serve as a basic quantitative trading strategy.
Principles
The strategy is mainly based on two indicators: Donchian Channel and ATR.
Donchian Channel is constructed by highest high and lowest low. The default channel length is 20 days, plotted with 20-day highest high and lowest low. Buy signal is generated when price breaks out above the upper band, and sell signal when price breaks below the lower band.
ATR measures volatility of the market and is used for stop loss setting. The default ATR period is 20 days. The strategy uses 2N ATR as the stop loss level.
The specific trading logic is:
-
Go long when price breaks out above the upper band.
-
Set stop loss at the low price at entry minus 2N ATR.
-
Close long position when price breaks below the lower band.
-
Go short when price breaks out below the lower band.
-
Set stop loss at the high price at entry plus 2N ATR.
-
Close short position when price breaks above the upper band.
In summary, the strategy identifies trend direction and entry signals with Donchian Channel, and controls risk with ATR based stop loss, to follow trends.
Advantage Analysis
The main advantages of this strategy are:
-
Strong drawdown control ability. ATR stop loss can effectively limit single trade loss.
-
Ability to follow trends. Donchian Channel can effectively identify breakouts and trend changes.
-
Applicable for high volatility instruments. ATR considers market volatility in stop loss setting.
-
Simple and clear logic, easy to understand and implement.
-
Flexibility to optimize with Python language.
Risk Analysis
Some risks of this strategy to note:
-
Channel parameters need optimization for different instruments and timeframes.
-
Consecutive stop loss risk. Multiple stop loss triggers may occur under volatile market conditions.
-
ATR parameter needs backtesting. ATR directly affects stop loss and should be adjusted based on volatility.
-
Potentially too high trading frequency. Too many whipsaw signals may occur under range-bound market.
-
Limited profit potential. The strategy focuses on stop loss and cannot fully capture trend gains.
-
Insufficient stop loss during volatile moves. Price gaps may directly trigger stop loss.
Optimization Directions
The strategy can be improved in the following aspects:
-
Optimize channel parameters for different instruments.
-
Add filters to avoid too many signals under range-bound market. Consider breakout magnitude or volume filters.
-
Optimize ATR period parameter and test impact on stop loss.
-
Add pyramid entry to increase position size to maximize trend gains.
-
Incorporate other indicators such as MACD, KD to avoid false signals.
-
Adjust stop loss based on slippage and commission costs.
-
Test adaptiveness across different instruments and optimize parameters.
Summary
As an introductory version of Turtle Trading system, this strategy has simple and clear logic, strong drawdown control ability, and can effectively validate the principles of Turtle Trading. But adaptiveness across instruments is weak and parameters need to be tuned based on specific instruments. With optimizations like parameter tuning, adding filters, this can serve as a basic trend following strategy for quantitative trading.
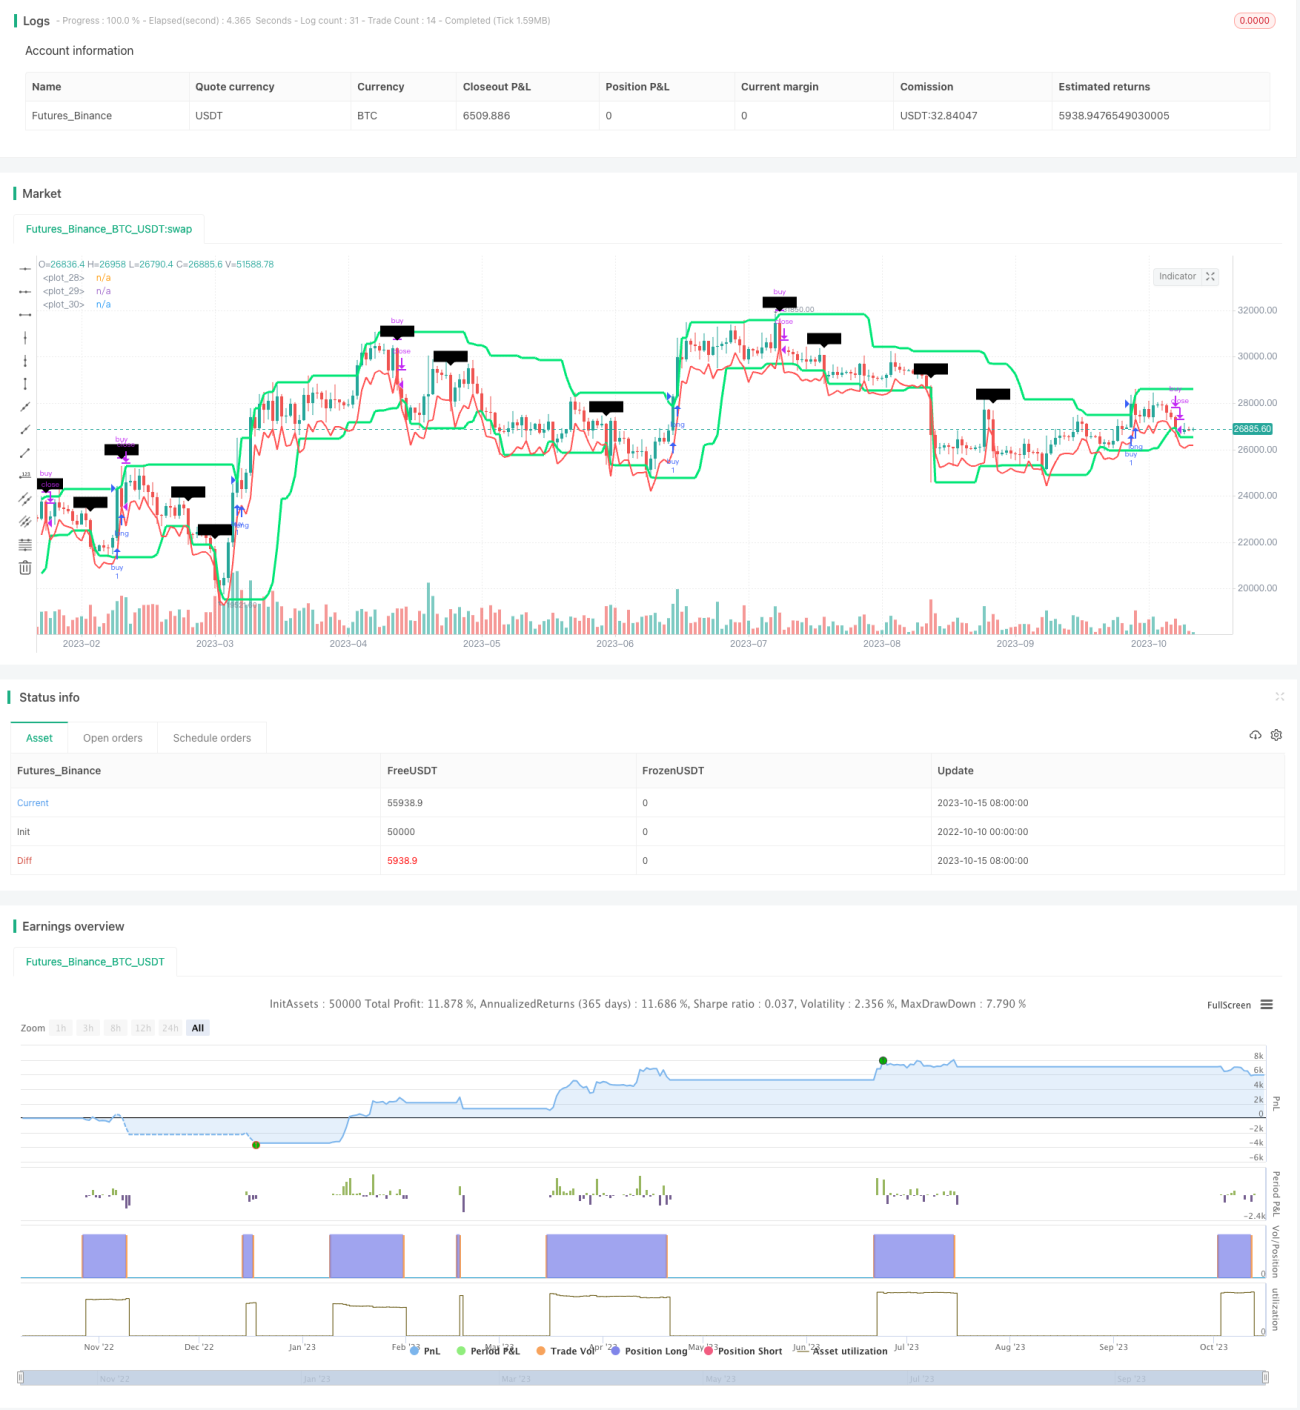
/*backtest
start: 2022-10-10 00:00:00
end: 2023-10-16 00:00:00
period: 1d
basePeriod: 1h
exchanges: [{"eid":"Futures_Binance","currency":"BTC_USDT"}]
*/

//@version=3
//Based on Turtle traders strategy: buy/sell on Donchian breakouts and stop loss on ATR 2x
// initial version considerations :
//// 1. Does not consider filter for avoiding new entries after winning trades (filtering rule from Turtle Strategy on 20 day breakout strategy) - 1