Dual Moving Average Bollinger Band System Strategy

Overview
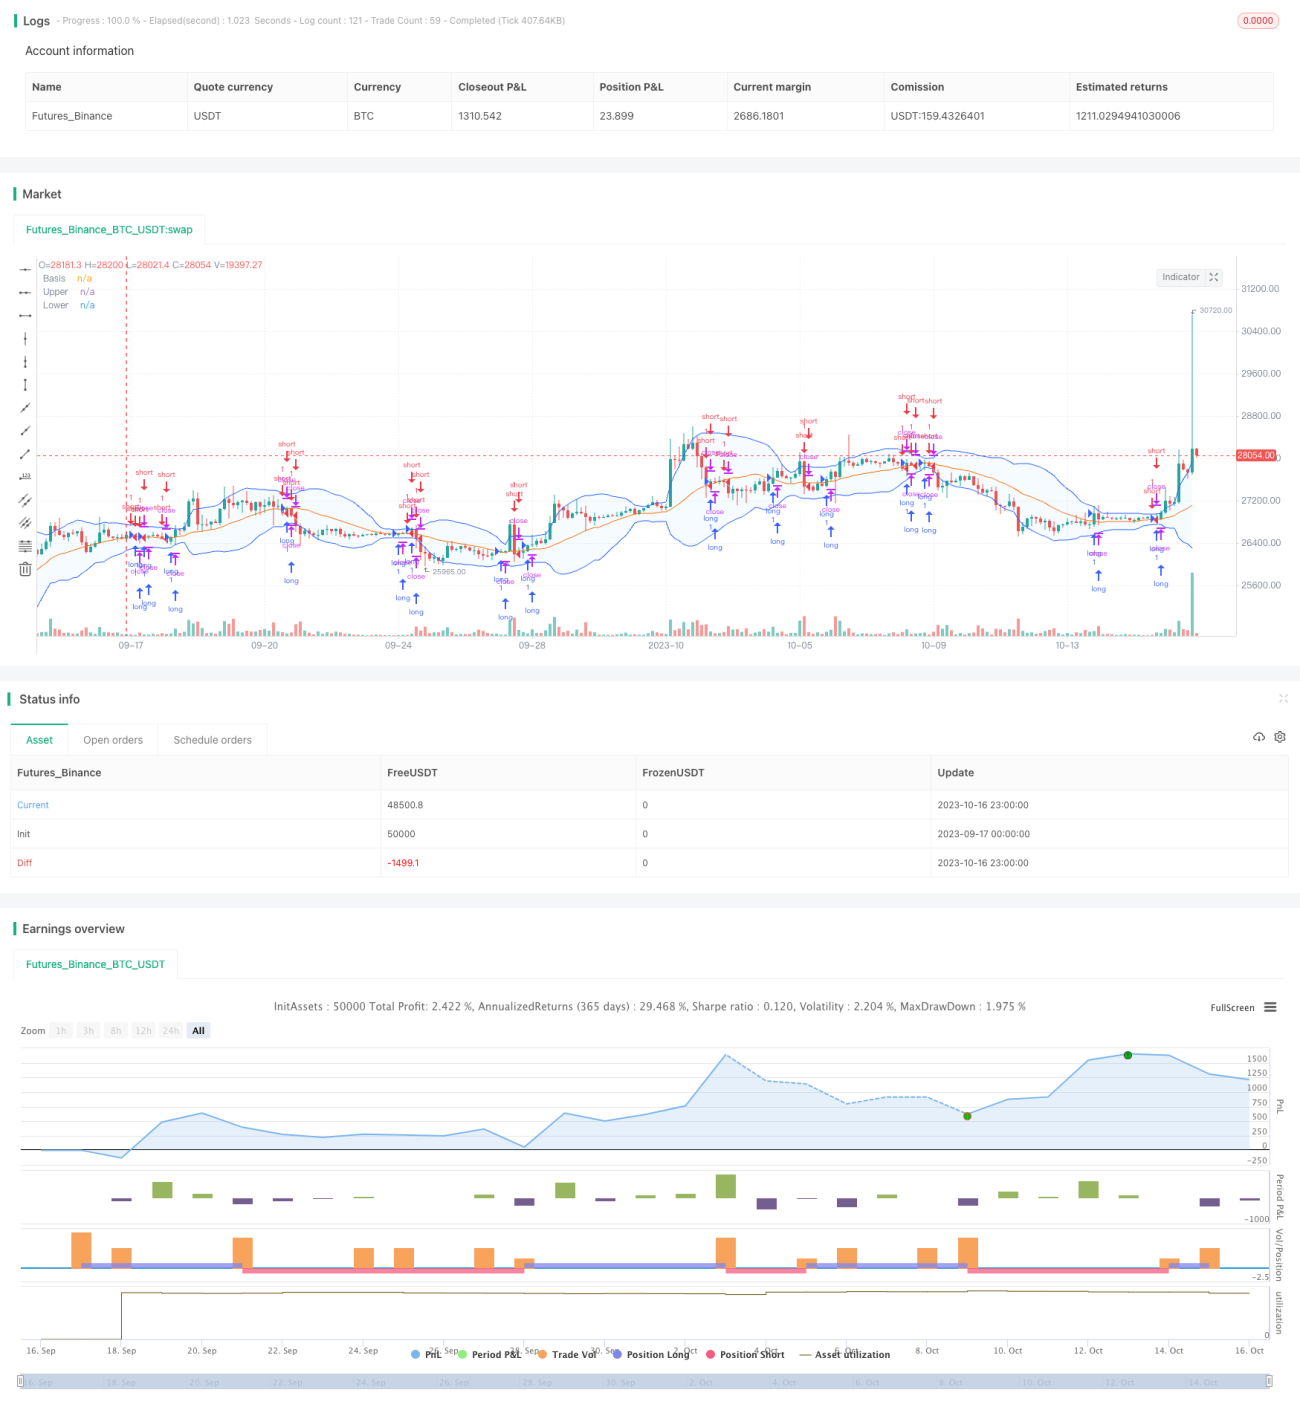
The Dual Moving Average Bollinger Band system strategy is a typical touch trading strategy. It utilizes the volatility indicator Bollinger Bands and dual-line touches to open positions, along with stop profit and stop loss mechanisms to manage funds and generate profits.
Principles
This strategy is mainly based on the Bollinger Bands indicator. Bollinger Bands consist of a moving average line and bandwidth. The strategy first calculates the moving average of closing prices over n periods as the middle band, with the bandwidth being m times the standard deviation of the middle band. The upper band and lower band are then plotted as m standard deviations above and below the middle band. When price touches the upper band, a short position is opened. When price touches the lower band, a long position is opened.
Specifically, the strategy implements the following steps:
-
Input parameters: set moving average length n and standard deviation multiplier m
-
Calculate middle band: n-period simple moving average of closing prices
-
Calculate upper band: middle band + m * n-period standard deviation of closing prices
-
Calculate lower band: middle band - m * n-period standard deviation of closing prices
-
Plot the middle, upper and lower bands
-
When closing price crosses above middle band, go long
-
When closing price crosses below middle band, go short
-
Set stop profit and stop loss points to exit positions
Entering positions on dual-line touches together with stop profit and stop loss mechanisms can effectively control risks and generate steady profits.
Advantages
The advantages of this strategy include:
-
Simple and clear rules, easy to implement.
-
Based on Bollinger Bands indicator with scientific rationale.
-
Dual-line touches filter false breakouts in ranging markets.
-
Contains stop profit and stop loss, managing risks.
-
Sufficient backtesting data ensures reliability.
-
Large parameter tuning space for optimization.
Risks
There are some risks to consider:
-
Bollinger Bands are sensitive to parameters which may lead to varied results.
-
Dual-line entry may miss trading opportunities due to low frequency.
-
Improper stop profit and stop loss settings may lead to premature stop loss or insufficient profits.
-
Large losses may occur when market trend changes.
-
Shorter backtesting timeframe may lead to overfitting risks.
Possible solutions:
-
Optimize parameters to find best combination.
-
Narrow bands to increase frequency.
-
Adjust stops based on different markets.
-
Add trend filter to avoid counter-trend trades.
-
Expand backtest timeframe to ensure robustness.
Improvements
Some ways to improve the strategy:
-
Optimize parameters for better entries. More comprehensive parameter tuning can find optimal parameter sets.
-
Add trend detection. Trend filters prevent trading against the trend.
-
Optimize exits. Dynamic or trailing stops can improve profit management.
-
Add filters with other indicators. MACD, KDJ etc. can help filter false breakouts.
-
Incorporate machine learning models like LSTM to further optimize.
-
Combine with other basic or advanced strategies for portfolio management.
Conclusion
The Dual Moving Average Bollinger Band system demonstrates overall positive results, with advantages like scientific indicators, clear rules, and flexible parameters. Further improvements to parameters, exits, and trend filters can enhance stability. Combining with other strategies and frameworks can also boost strategy performance and maximize value.
- 1