Dual Moving Average and RSI Reversal Trading Strategy

Overview
This strategy combines dual moving averages and the relative strength index (RSI) to identify short-term reversal opportunities during strong trends. It aims to enter trades against the momentum when the trend direction is clear, by using RSI to detect overbought and oversold conditions and waiting for the price to reverse. The strategy is suitable for markets with obvious trends, capturing partial reversals without trading against the overall trend.
Strategy Logic
-
Calculate the 30-day simple moving average (SMA) and 200-day exponential moving average (EMA) to determine the overall trend direction.
- SMA>EMA suggests an upward trend
- SMA<EMA suggests a downward trend
-
Calculate the 30-day RSI to identify overbought and oversold conditions.
- RSI<=53 is considered oversold
- RSI>=60 is considered overbought
-
Entry rules:
- Go long when in an upward trend (SMA>EMA) and RSI<=53
- Go short when in a downward trend (SMA<EMA) and RSI>=60
-
Exit rules:
- Close long position for stop loss or take profit
- Close short position for stop loss or take profit
Advantage Analysis
-
Follows the major trend, avoids trading against the trend
-
Conservative RSI settings avoid false signals
-
Dual moving average filter improves entry timing accuracy
-
Controllable risk, small drawdowns
Risk Analysis
-
Needs obvious trending markets, less effective in ranging markets
-
Conservative RSI settings may miss some opportunities
-
Stop loss placement needs to be reasonable to avoid premature exits
Improvement Directions
-
Optimize RSI parameters to find more entry opportunities
-
Test different moving average combinations
-
Add trend filter, only trade when trend is strong enough
-
Optimize stop loss strategy to control loss on single trades
Conclusion
The strategy has controllable risks overall, suitable for medium-long term position traders. It trades with the major trend direction, uses conservative RSI settings and strict moving average filters to avoid false breakouts, improving win rate. There is also room for potential improvements with parameter tuning to gain more opportunities. Risk control is essential to maintain a long-term trading mentality.
/*backtest
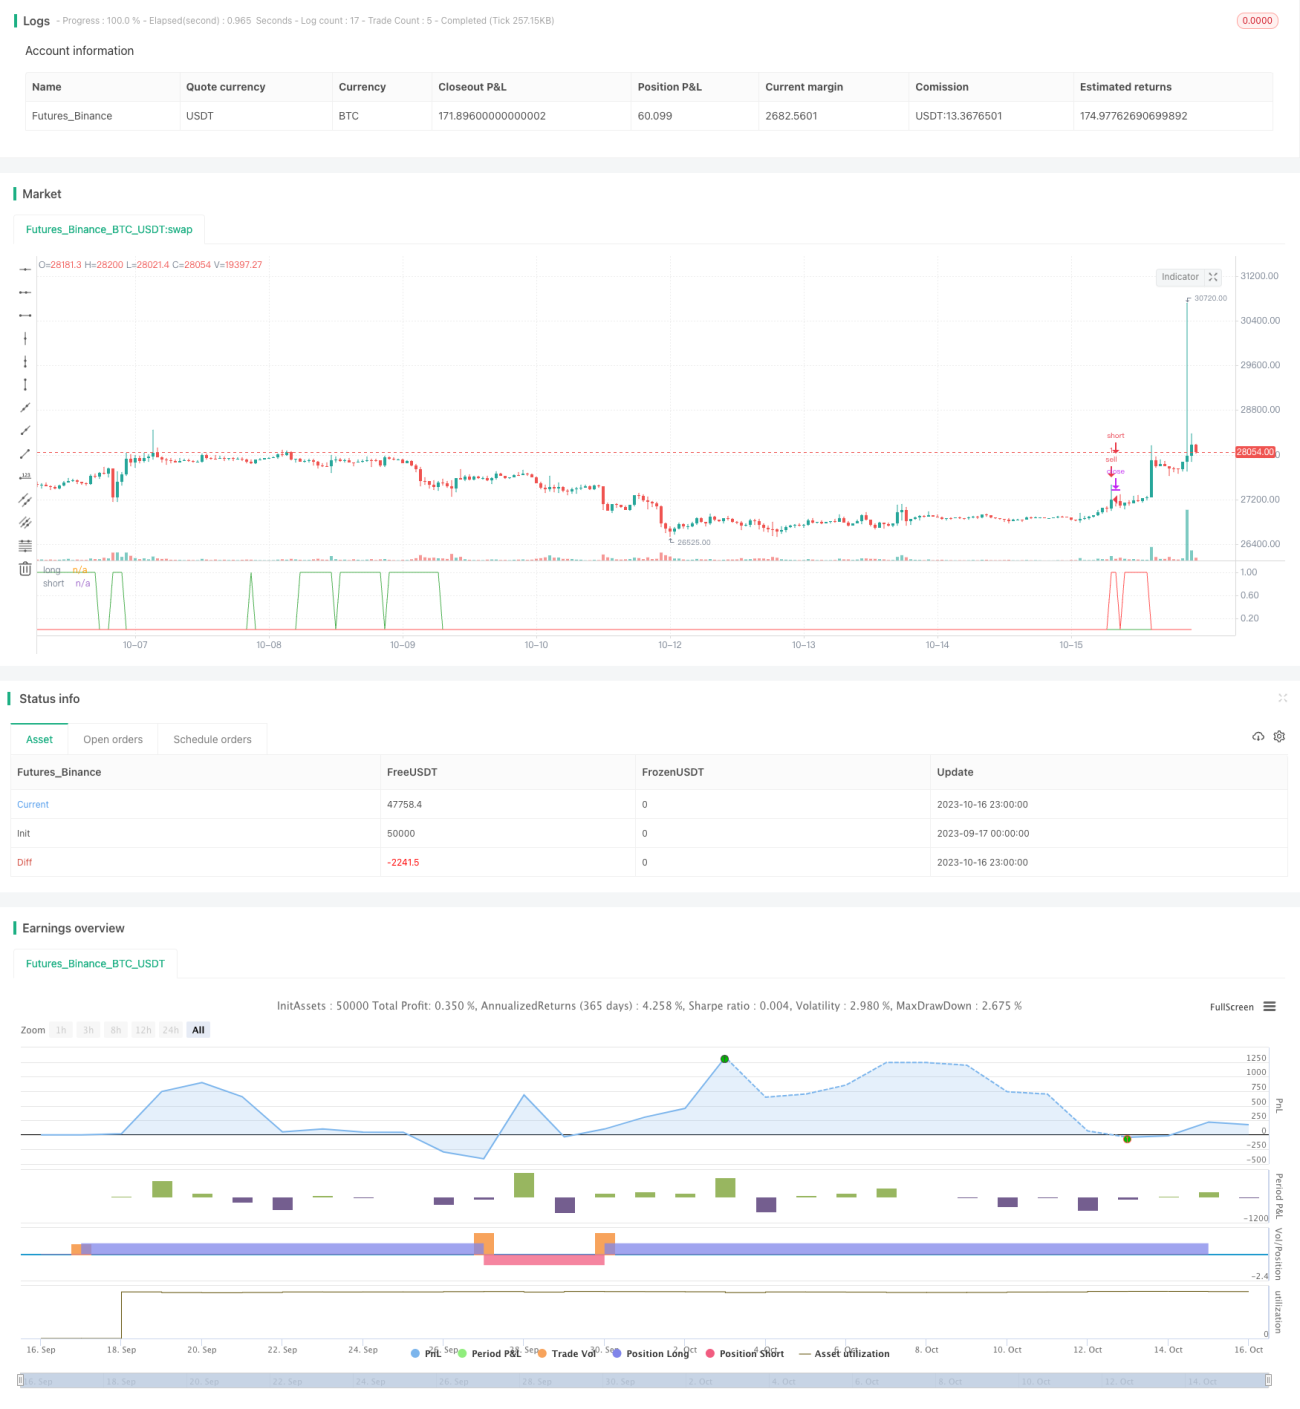
start: 2023-09-17 00:00:00
end: 2023-10-17 00:00:00
period: 1h
basePeriod: 15m
exchanges: [{"eid":"Futures_Binance","currency":"BTC_USDT"}]
*/
//@version=4
//Based on Larry Connors RSI-2 Strategy - Lower RSI
strategy(title="_CM_RSI_2_Strat_Low", shorttitle="_CM_RSI_2_Strategy_Lower", overlay=false)
src = close, - 1