Open-High Cross Over Trading Strategy

Author: ChaoZhang, Date: 2023-10-18 11:22:57
Tags:

img

Overview

This strategy generates trading signals based on the crossover between open and high prices. It goes long when open price crosses above high price and goes short when open price crosses below high price. Moving averages can be used to smooth the price data and reduce noisy trades. Various types and parameters of moving averages are configurable. Trailing stop loss can also be enabled to lock in profits.

Strategy Logic

  1. Determine whether to use an alternate resolution based on the input parameter useRes. If enabled, set the resolution with stratRes.

  2. Decide whether to use moving average (useMA) based on input parameter. If enabled, select MA type with basisType and set period length with basisLen.

  3. Get open price (open) and close price (close) series data. Apply selected MA with configured parameters if useMA enabled.

  4. Compare current open price x with open series openSeries. If x is greater than openSeries, set trendState to long, otherwise to short.

  5. Generate long signal longCond when open price crosses above open MA series. Generate short signal shortCond when open price crosses below open MA series.

  6. Enter long or short positions based on long and short signals. Set stop loss points and offset if trailing stop loss is enabled.

Advantages

  1. Uses two different price series, open and high, avoiding limitations of single series.

  2. MA techniques filter out short-term noise and focus on major trend.

  3. Flexible configuration of MA types and parameters for optimal effect.

  4. Optional trailing stop loss to control risk and lock in profits.

  5. High optimization space to adjust parameters for different products and market environments.

Risks

  1. Single signal source leads to scarce signals and potentially missed trades.

  2. MA lag may result in missing short-term opportunities.

  3. Improper stop loss configuration could lead to premature exit or excess loss.

  4. Poor parameter tuning could cause excessive fictional trades affecting live performance.

  5. Parameter optimization is challenging for different products and environments.

  6. Add more indicators or ML models to enrich signal sources. Fine tune MA types and parameters. Set stop loss carefully with some buffer to capture more profit. Thoroughly backtest and optimize parameters.

Optimization Directions

  1. Incorporate additional indicators like Bollinger Bands, KD etc. to expand signal sources.

  2. Apply machine learning models for signal generation.

  3. Optimize MA parameters to find best configurations.

  4. Balance stop loss levels between risk and profit capture.

  5. Add parameter optimization methods to auto find optimal settings.

  6. Develop specialized parameter templates for different products.

  7. Build quantitative backtesting frameworks for quick strategy iterations.

Summary

This strategy generates signals based on open-high crossovers and uses MAs to filter noise. It offers flexibility through configurable parameters. The strategy has advantages but also some problems like sparse signals and lag. Further improvements can be made through more indicators, machine learning models etc. Extensive parameter tuning and optimization is needed for the best performance across different products and market environments.
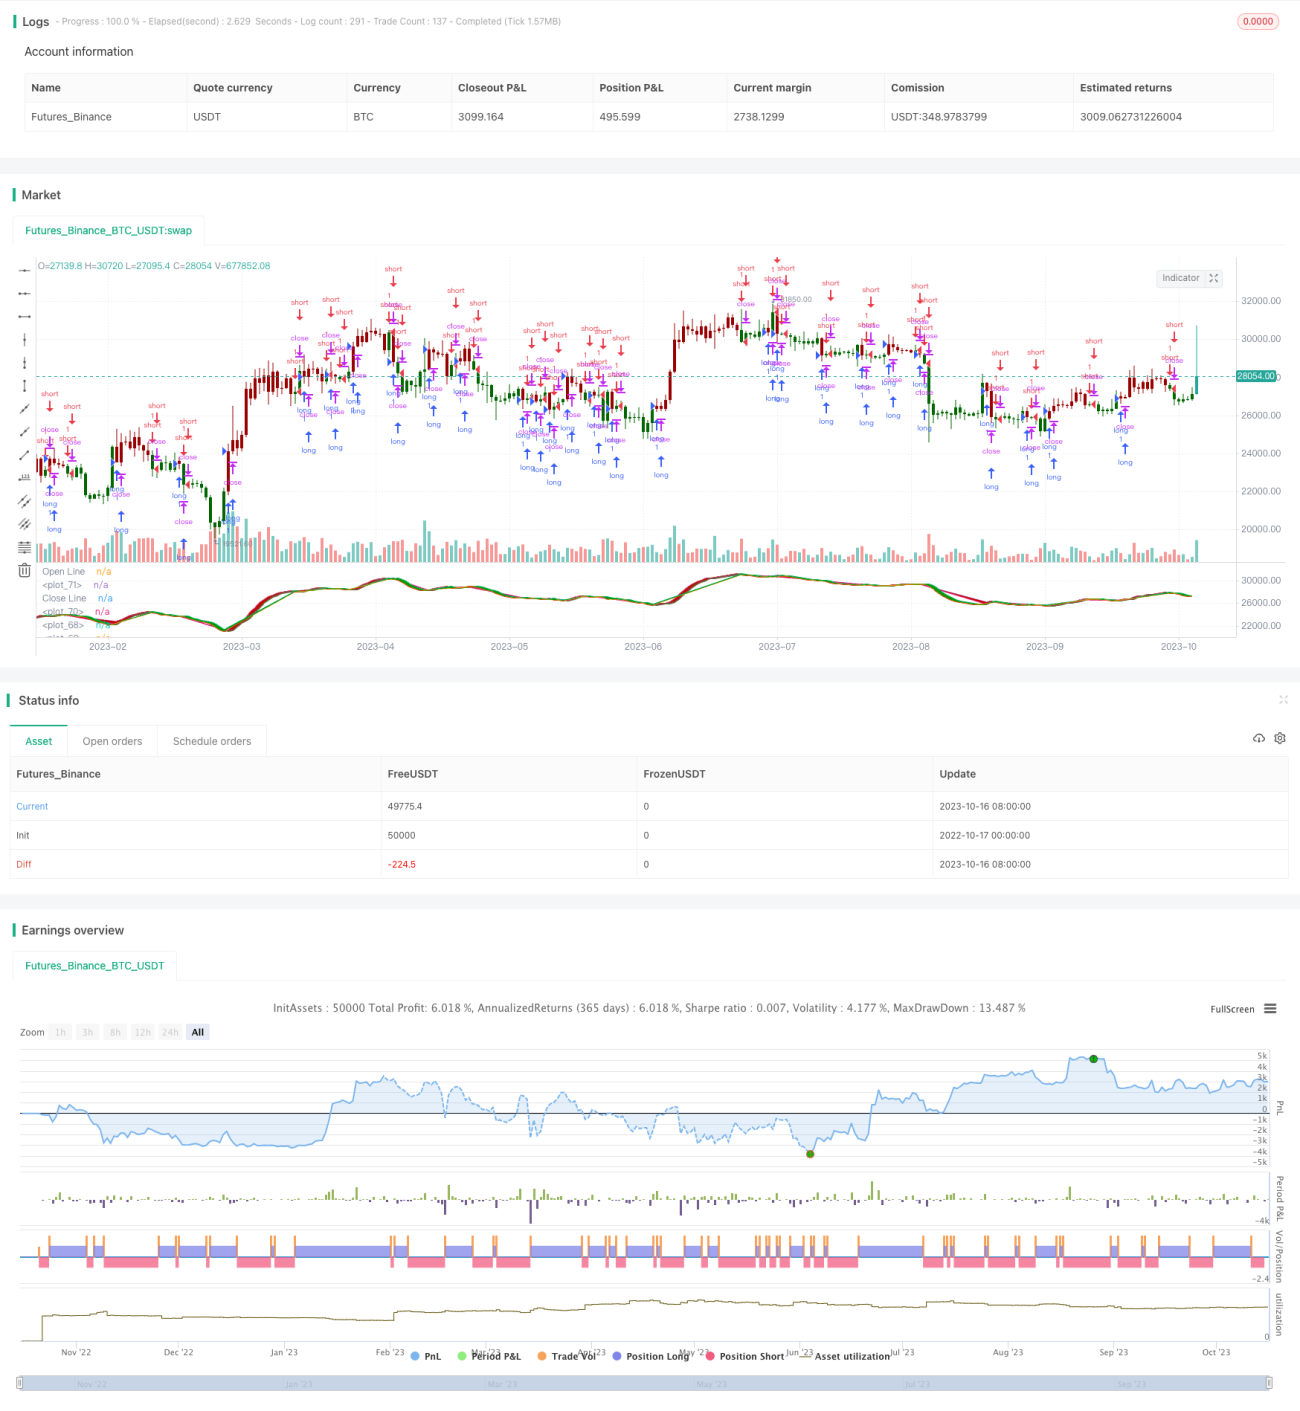

/*backtest
start: 2022-10-17 00:00:00
end: 2023-10-17 00:00:00
period: 1d
basePeriod: 1h
exchanges: [{"eid":"Futures_Binance","currency":"BTC_USDT"}]
*/

//@version=2

//strategy(title = "Open Close Cross Strategy", shorttitle = "OCC Strategy", overlay = true, pyramiding = 0, default_qty_type = strategy.percent_of_equity, default_qty_value = 10)

// Revision:        1
// Author:          @JayRogers
//
// Description:
//  - Strategy based around Open-Close Crossovers.
// Setup:
//  - I have generally found that setting the strategy resolution to 3-4x that of the chart you are viewing
//    tends to yield the best results, regardless of which MA option you may choose (if any)
//  - Don't aim for perfection. Just aim to get a reasonably snug fit with the O-C band, with good runs of
//    green and red.
//  - Option to either use basic open and close series data, or pick your poison with a wide array of MA types.
//  - Optional trailing stop for damage mitigation if desired (can be toggled on/off)
//  - Positions get taken automagically following a crossover - which is why it's better to set the resolution
//    of the script greater than that of your chart, so that the trades get taken sooner rather than later.
//  - If you make use of the trailing stops, be sure to take your time tweaking the values. Cutting it too fine
//    will cost you profits but keep you safer, while letting them loose could lead to more drawdown than you
//    can handle.

// === INPUTS ===
useRes      = input(defval = true, title = "Use Alternate Resolution? ( recommended )")
stratRes    = input(defval = "120", title = "Set Resolution ( should not be lower than chart )")
useMA       = input(defval = true, title = "Use MA? ( otherwise use simple Open/Close data )")
basisType   = input(defval = "DEMA", title = "MA Type: SMA, EMA, DEMA, TEMA, WMA, VWMA, SMMA, HullMA, LSMA, ALMA ( case sensitive )")
basisLen    = input(defval = 14, title = "MA Period", minval = 1)
offsetSigma = input(defval = 6, title = "Offset for LSMA / Sigma for ALMA", minval = 0)
offsetALMA  = input(defval = 0.85, title = "Offset for ALMA", minval = 0, step = 0.01)
useStop     = input(defval = true, title = "Use Trailing Stop?")
slPoints    = input(defval = 200, title = "Stop Loss Trail Points", minval = 1)
slOffset    = input(defval = 400, title = "Stop Loss Trail Offset", minval = 1)
// === /INPUTS ===

// === BASE FUNCTIONS ===
// Returns MA input selection variant, default to SMA if blank or typo.
variant(type, src, len, offSig, offALMA) =>
    v1 = sma(src, len)                                                  // Simple
    v2 = ema(src, len)                                                  // Exponential
    v3 = 2 * v2 - ema(v2, len)                                          // Double Exponential
    v4 = 3 * (v2 - ema(v2, len)) + ema(ema(v2, len), len)               // Triple Exponential
    v5 = wma(src, len)                                                  // Weighted
    v6 = vwma(src, len)                                                 // Volume Weighted
    v7 = na(v5[1]) ? sma(src, len) : (v5[1] * (len - 1) + src) / len    // Smoothed
    v8 = wma(2 * wma(src, len / 2) - wma(src, len), round(sqrt(len)))   // Hull
    v9 = linreg(src, len, offSig)                                       // Least Squares
    v10 = alma(src, len, offALMA, offSig)                               // Arnaud Legoux
    type=="EMA"?v2 : type=="DEMA"?v3 : type=="TEMA"?v4 : type=="WMA"?v5 : type=="VWMA"?v6 : type=="SMMA"?v7 : type=="HullMA"?v8 : type=="LSMA"?v9 : type=="ALMA"?v10 : v1
// security wrapper for repeat calls
reso(exp, use, res) => use ? request.security(syminfo.tickerid, res, exp) : exp
// === /BASE FUNCTIONS ===

// === SERIES SETUP ===
// open/close
//closeSeries = useMA ? reso(variant(basisType, close, basisLen, offsetSigma, offsetALMA), useRes, stratRes) : reso(close, useRes, stratRes)
openSeries  = useMA ? reso(variant(basisType, open, basisLen, offsetSigma, offsetALMA), useRes, stratRes) : reso(open, useRes, stratRes)
x = openSeries[1]
trendState  = x > openSeries ? true : x < openSeries ? false : trendState[1]
// === /SERIES ===

// === PLOTTING ===
barcolor(color = x > openSeries ? #006600 : #990000, title = "Bar Colours")
// channel outline
closePlot   = plot(x, title = "Close Line", color = #009900, linewidth = 2, style = line, transp = 90)
openPlot    = plot(openSeries, title = "Open Line", color = #CC0000, linewidth = 2, style = line, transp = 90)
// channel fill
closePlotU  = plot(trendState ? x : na, transp = 100, editable = false)
openPlotU   = plot(trendState ? openSeries : na, transp = 100, editable = false)
closePlotD  = plot(trendState ? na : x, transp = 100, editable = false)
openPlotD   = plot(trendState ? na : openSeries, transp = 100, editable = false)
fill(openPlotU, closePlotU, title = "Up Trend Fill", color = #009900, transp = 40)
fill(openPlotD, closePlotD, title = "Down Trend Fill", color = #CC0000, transp = 40)
// === /PLOTTING ===

// === STRATEGY ===
// conditions
longCond    = crossover(openSeries, x)
shortCond   = crossunder(openSeries, x)
// entries and base exit
strategy.entry("long", true, when = longCond)
strategy.entry("short", false, when = shortCond)
// if we're using the trailing stop
//if (useStop)
//    strategy.exit("XL", from_entry = "long", trail_points = slPoints, trail_offset = slOffset)
//    strategy.exit("XS", from_entry = "short", trail_points = slPoints, trail_offset = slOffset)
// not sure needed, but just incase..
//strategy.exit("XL", from_entry = "long", when = shortCond)
//strategy.exit("XS", from_entry = "short", when = longCond)
// === /STRATEGY ===

More