The Multi Timeframe Bottom Reversal Strategy

Author: ChaoZhang, Date: 2023-10-18 12:27:29
Tags:

img

Overview

This strategy combines multiple bottom pattern indicators to identify major reversal opportunities, adopting a trend following stop loss strategy to target profits exceeding stop loss.

Principle

The strategy mainly uses the following indicators to determine bottom reversal:

  1. Bottom Sensivity Indicator (Noro’s BottomSensivity): Detect specific bottom patterns on the candlestick chart.

  2. Certainty of Volition Index (CVI): Determine the shift in bullish/bearish sentiment.

  3. Ultimate Cycle Signal (UCS): Detect oversold below the moving average.

  4. Relative Strength Index (RSI): Identify oversold conditions.

  5. Pattern Combination: Including candlestick, pin bar and other bottom patterns.

The strategy combines multiple bottom indicators, generating buy signals when the number of bottom patterns meets the parameter settings. To filter false breaks, RSI is also used to trigger buy only in oversold conditions.

Users can customize the usage and parameters of each bottom indicator, providing high flexibility. The SMA filter avoids buying into a downtrend.

Advantages

  • Improved accuracy using multiple indicators

  • Customizable parameters suit different products

  • SMA filter prevents buying tops

  • Optional red candles only reduce risk

  • Alerts allow realtime monitoring

Risks

  • Multiple indicators may miss bottoms

  • Bottom patterns do not always reverse

  • Need to watch if volume supports reversal

Enhancement

  • Optimize parameters for different products

  • Add position sizing to lower cost basis

  • Implement stop loss to lock in profits

Summary

The strategy effectively identifies bottoms with multiple indicators, controlling risk with trend following stop loss. But volume support needs monitoring. Users can optimize parameters per product characteristics.
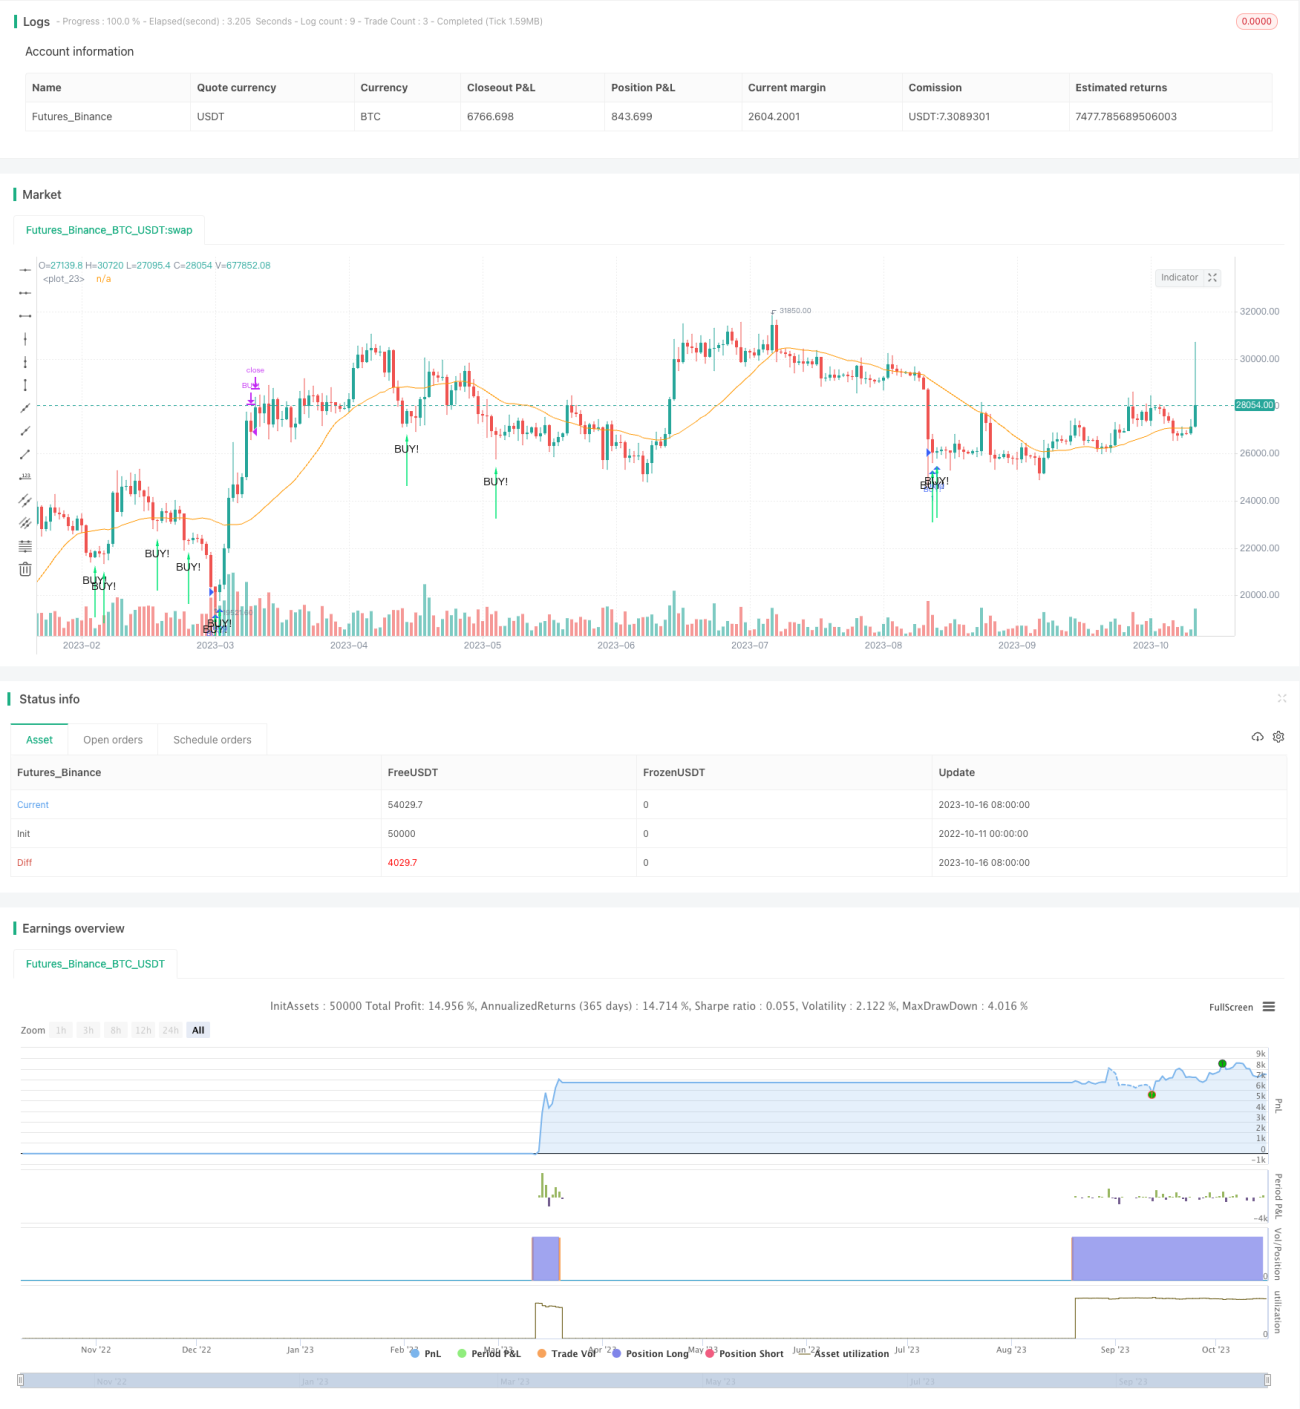

/*backtest
start: 2022-10-11 00:00:00
end: 2023-10-17 00:00:00
period: 1d
basePeriod: 1h
exchanges: [{"eid":"Futures_Binance","currency":"BTC_USDT"}]
*/

// the original indicator is Noro's BottomSensivity v0.6
//@version=4
strategy("Noro's BottomSensivity v0.6 strategy + rsi + Alarm", shorttitle="Bottom 0.6 StRsiAlarm", overlay=true)

overSold = input(35)
overBought = input(70)
botsens = input(defval = 3, minval = 1, maxval = 4, title = "Bottom-Sensivity")
smalen = input(defval = 25, minval = 20, maxval = 200, title = "SMA Length")
bars = input(defval = 3, minval = 2, maxval = 4, title = "Bars of Locomotive")
useloc = input(true, title = "Use bottom-pattern Locomotive?")
usepin = input(true, title = "Use bottom-pattern Pin-bar?")
usecvi = input(true, title = "Use bottom-indicator CVI?")
useucs = input(true, title = "Use bottom-indicator UCS?")
usevix = input(true, title = "Use bottom-indicator WVF?")
usersi = input(true, title = "Use bottom-indicator RSI?")
usered = input(false, title = "Only red candles?")
usesma = input(true, title = "Use SMA Filter?")
showsma = input(false, title = "Show SMA Filter?")

//SMA Filter
sma = sma(close, smalen)
colsma = showsma == true ? red : na
plot(sma, color = colsma)

//VixFix method
//Start of ChrisMoody's code
pd = 22
bbl = 20
mult = 2
lb = 50
ph = .85
pl = 1.01
hp = false
sd = false
wvf = ((highest(close, pd)-low)/(highest(close, pd)))*100
sDev = mult * stdev(wvf, bbl)
midLine = sma(wvf, bbl)
lowerBand = midLine - sDev
upperBand = midLine + sDev
rangeHigh = (highest(wvf, lb)) * ph
rangeLow = (lowest(wvf, lb)) * pl
//End of ChrisMoody's code

//Locomotive mmethod
bar = close > open ? 1 : close < open ? -1 : 0
locob = bar == 1 and bar[1] == -1 and bar[2] == -1 and (bar[3] == -1 or bars < 3) and (bar[4] == -1 or bars < 4) ? 1 : 0

//PIN BAR
body = abs(close - open)
upshadow = open > close? (high - open) : (high - close)
downshadow = open > close ? (close - low) : (open - low)
pinbar = open[1] > close[1] ? (body[1] > body ? (downshadow > 0.5 * body ? (downshadow > 2 * upshadow ? 1 : 0 ) : 0 ) : 0 ) : 0

//CVI method
//Start of LazyBear's code
ValC=sma(hl2, 3)
bull=-.51
bear=.43
vol=sma(atr(3), 3)
cvi = (close-ValC) / (vol*sqrt(3))
cb= cvi <= bull ? green : cvi >=bear ? red : cvi > bull ? blue : cvi < bear ? blue : na
bull1 = cvi <= bull
bear1 = cvi >= bear
bull2 = bull1[1] and not bull1
bear2 = bear1[1] and not bear1
//End of LazyBear's code

//UCS method
//Start of UCS's code
ll = lowest(low, 5)
hh = highest(high, 5)
diff = hh - ll
rdiff = close - (hh+ll)/2
avgrel = ema(ema(rdiff,3),3)
avgdiff = ema(ema(diff,3),3)
mom = ((close - close[3])/close[3])*1000
SMI = avgdiff != 0 ? (avgrel/(avgdiff/2)*100) : 0
SMIsignal = ema(SMI,3)
ucslong = SMI < -35  and mom > 0 and mom[1] < 0 ? 1 : 0
//End of UCS's code

//RSI method
//Chris Moody's code
up = rma(max(change(close), 0), 2)
down = rma(-min(change(close), 0), 2)
rsi = down == 0 ? 100 : up == 0 ? 0 : 100 - (100 / (1 + up / down))
rsib = rsi < 10 ? 1 : 0
//Chris Moody's code

//sum
locobot = useloc == false ? 0 : locob
vixfixbot = usevix == false ? 0 : wvf >= upperBand or wvf >= rangeHigh ? 1 : 0
cvibot = usecvi == false ? 0 : bull2 == true ? 1 : 0
ucsbot = useucs == false ? 0 : ucslong == 1 ? 1 : 0
rsibot = usersi == false ? 0 : rsib
pinbot = usepin == false ? 0 : pinbar
score = vixfixbot + locobot + cvibot + ucsbot + rsibot + pinbot

//arrows
bottom = usered == false ? usesma == false ? score >= botsens ? 1 : 0 : high < sma and score >= botsens ? 1 : 0 : usesma == false ? score >= botsens and close < open ? 1 : 0 : high < sma and score >= botsens and close < open ? 1 : 0
plotarrow(bottom == 1 ? 1 : na, title="Buy arrow", colorup=lime, maxheight=60, minheight=50, transp=0)
data = bottom == 1
plotchar(data, char=" ", text="BUY!", location=location.belowbar, color=green, size=size.small)


//Market buy and exit
strategy.entry("BUY!", strategy.long, when =(bottom == 1) and(rsi(close,14)<overSold))
strategy.close("BUY!", when = (crossunder(rsi(close,14), overBought)))
alarm = bottom == 1 and(rsi(close,14)<overSold)
alertcondition(alarm == 1,title="BUY+RSI",message="BUY+RSI")

More