ATR Trailing Stop Bands Strategy

Overview
The core idea of this strategy is to use the Average True Range (ATR) indicator to set an adaptive trailing stop loss line to maximize the protection of profitable positions while avoiding premature stop loss. The ATR indicator can dynamically capture the volatility of the market and adjust the stop loss distance based on market volatility, ensuring effective stop loss while minimizing the probability of stop loss being triggered. This strategy also incorporates Bollinger Bands for visualizing the upper and lower limits of the stop loss line, with the option of adding wick protection to counter the whipsaw effect in ranging markets.
Strategy Logic
This strategy uses the N period average of ATR indicator multiplied by a factor as the base stop loss distance. The larger the ATR value, the larger the market volatility, so the wider the stop loss distance is set. The smaller the ATR value, the narrower the stop loss distance is set. This allows dynamic adjustment of stop loss distance based on market volatility.
Specifically, the strategy uses the following core logic:
-
Calculate the ATR value of the ATR period (nATRPeriod).
-
Obtain the base stop loss distance nLoss by multiplying the ATR value by a factor (nATRMultip).
-
Update the stop loss line xATRTrailingStop based on current high, low and stop loss line of previous period.
-
If current low triggers previous period's stop loss line, the stop loss line moves up to below the low by nLoss distance.
-
If current high triggers previous period's stop loss line, the stop loss line moves down to above the high by nLoss distance.
-
If stop loss is not triggered, adjust the stop loss line based on the distance of close price to it.
-
Add optional wick protection distance for further optimization of stop loss line.
-
Plot Bollinger Bands to visualize upper and lower limit of stop loss line.
-
Determine position direction based on color of stop loss line.
The strategy flexibly uses ATR indicator to enable the stop loss line to adjust adaptively based on market volatility, ensuring reasonable stop loss distance while avoiding excessive stop loss that causes unnecessary loss of positions.
Advantages
The advantages of this strategy:
-
Use ATR indicator to adjust stop loss distance dynamically adapting to different market conditions.
-
Customizable multiplier allows flexible adjustment of stop loss distance.
-
Addition of Bollinger Bands provides visualization of upper and lower limits of stop loss line.
-
Optional wick protection avoids whipsaw in ranging markets.
-
Can be used as trailing stop loss to maximize drawdown of profitable positions.
-
Strategy logic is clear and easy to understand with few optimizable parameters.
-
Applicable to multiple products and timeframes.
Risks
Some risks of this strategy to note:
-
ATR indicator reacts slowly to market shocks, leading to large stop loss distance.
-
Excessive multiplier setting also enlarges stop loss distance, increasing loss risk.
-
Wick protection can make stop loss line too loose when whipsaw increases.
-
Entry rules not considered, cannot be used as Entries/Exits strategy.
-
Extensive testing and optimization of parameters needed for different products and timeframes.
-
Stop loss breakout may enlarge losses, requiring effective capital management.
Optimization Directions
The strategy can be optimized in the following aspects:
-
Test different ATR periods to optimize stop loss distance.
-
Adjust multiplier to balance between stop loss distance and probability.
-
Optimize wick protection period to prevent whipsaw.
-
Try adding entry conditions on top of stop loss to make it Entries/Exits strategy.
-
Add trend indicator to adjust stop loss distance based on trend.
-
Adjust stop loss based on Elliott Waves theory.
-
Add position sizing to limit single loss amount.
Summary
This strategy utilizes the adaptive characteristic of ATR indicator to design a dynamic stop loss mechanism. While ensuring stop loss, it also minimizes unnecessary stop loss triggers. The strategy logic is simple and clear, allowing flexible optimization based on needs. It works best as trailing stop loss to maximize protection of profits. With proper parameter optimization and risk control, this strategy can be an effective stop loss tool in quantitative trading.
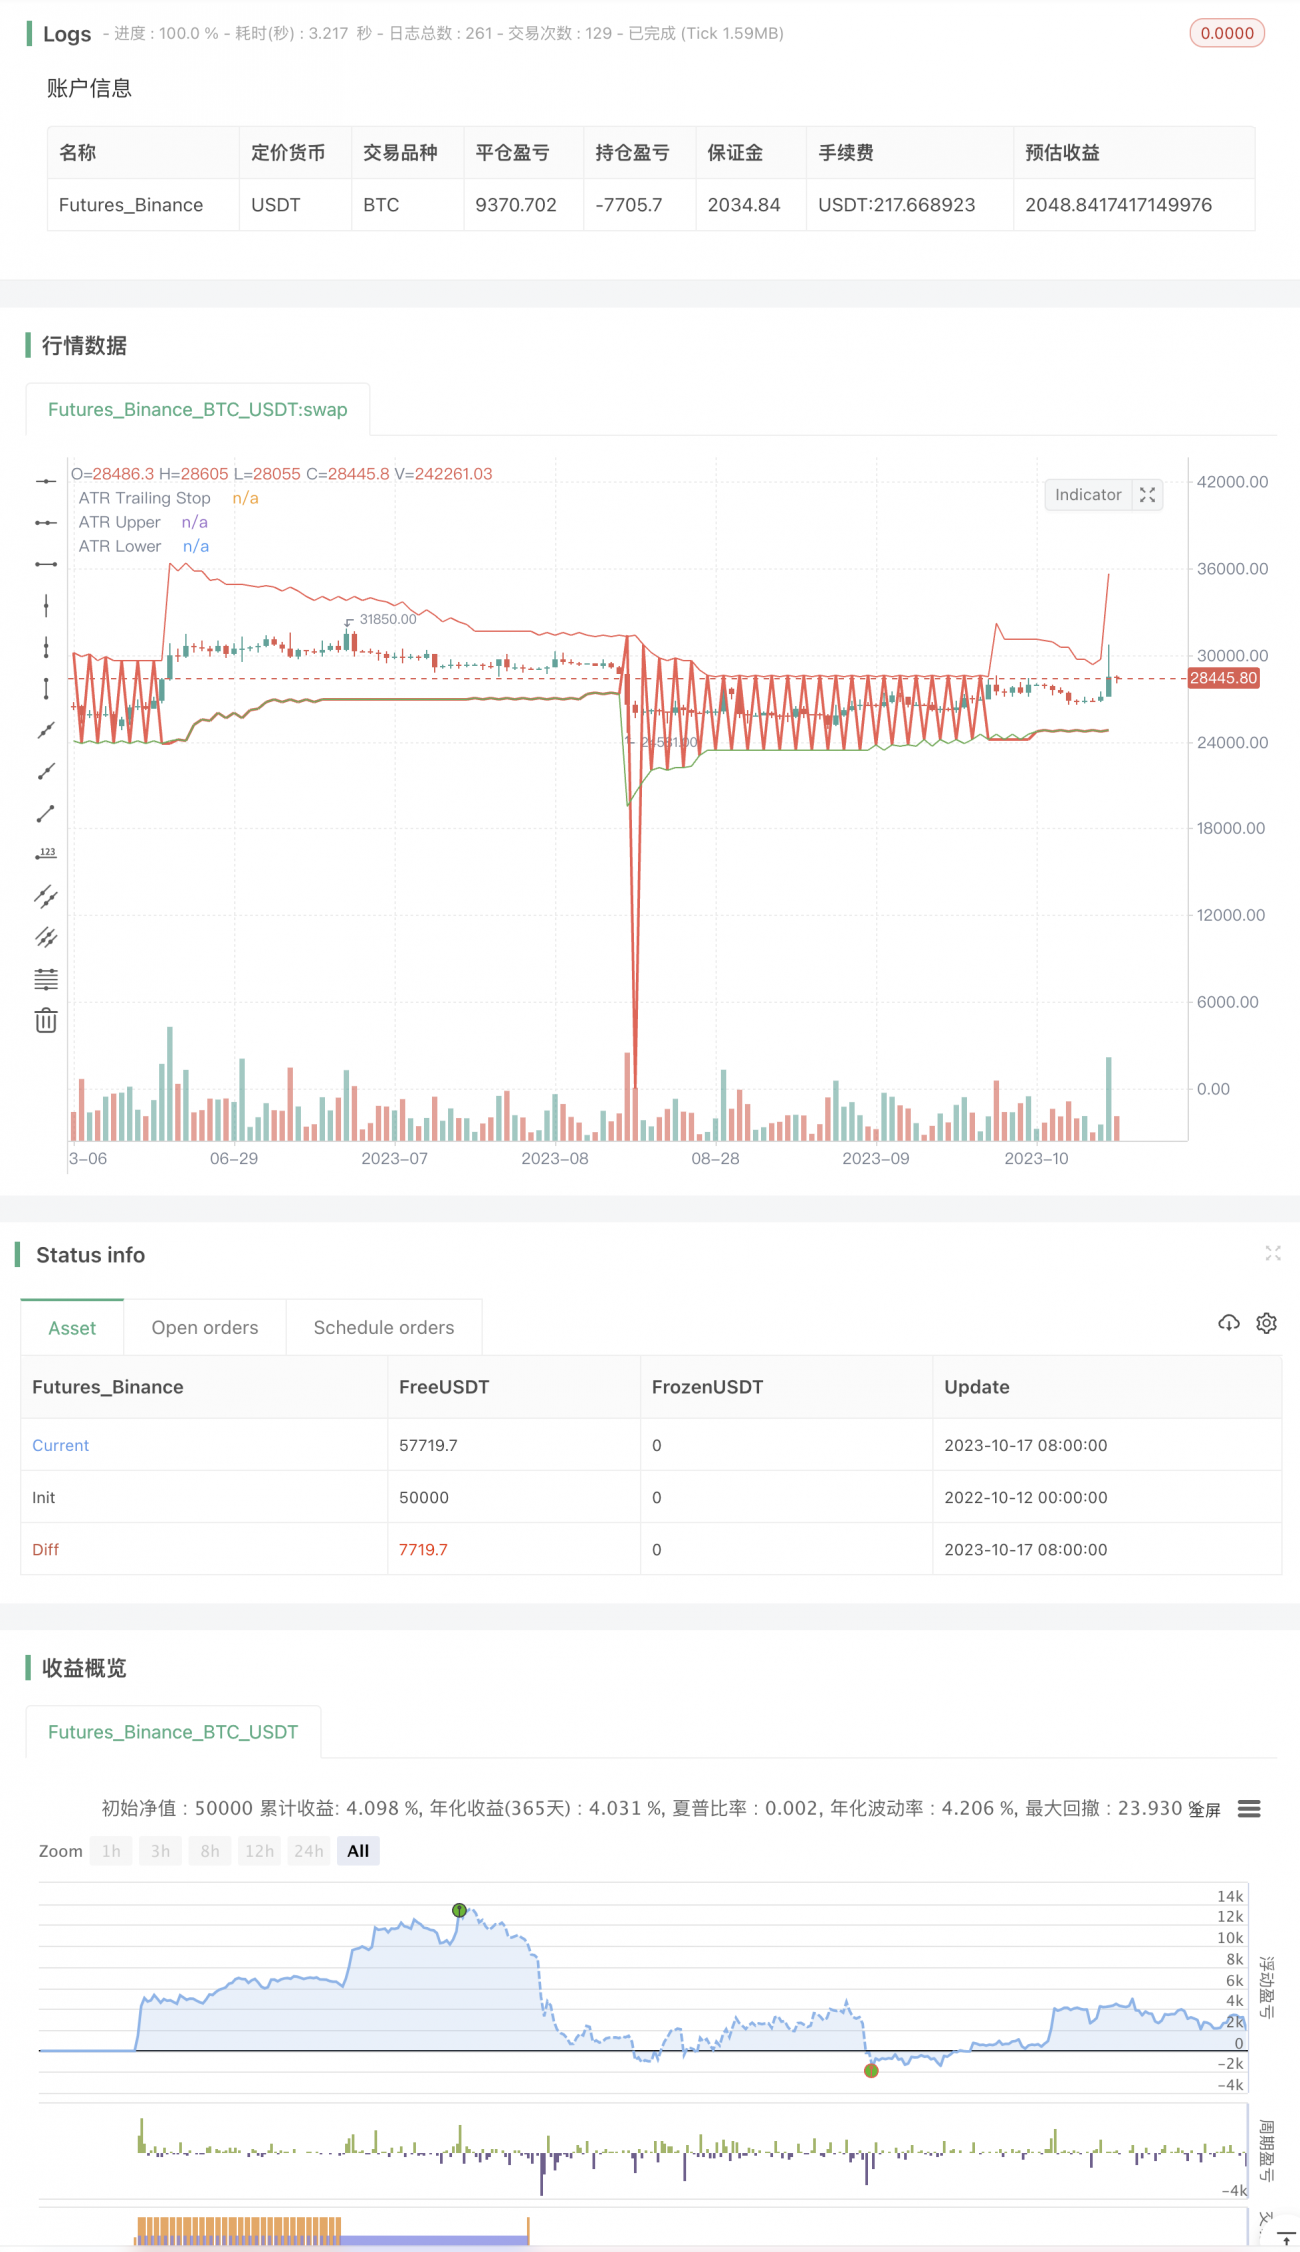
/*backtest
start: 2022-10-12 00:00:00
end: 2023-10-18 00:00:00
period: 1d
basePeriod: 1h
exchanges: [{"eid":"Futures_Binance","currency":"BTC_USDT"}]
*/

//@version=2
////////////////////////////////////////////////////////////
//  Copyright by HPotter v2.0 13/10/2014
// Average True Range Trailing Stops Strategy, by Sylvain Vervoort - 1