Ichimoku Lagging Cross Dual Line Trading Strategy

Overview
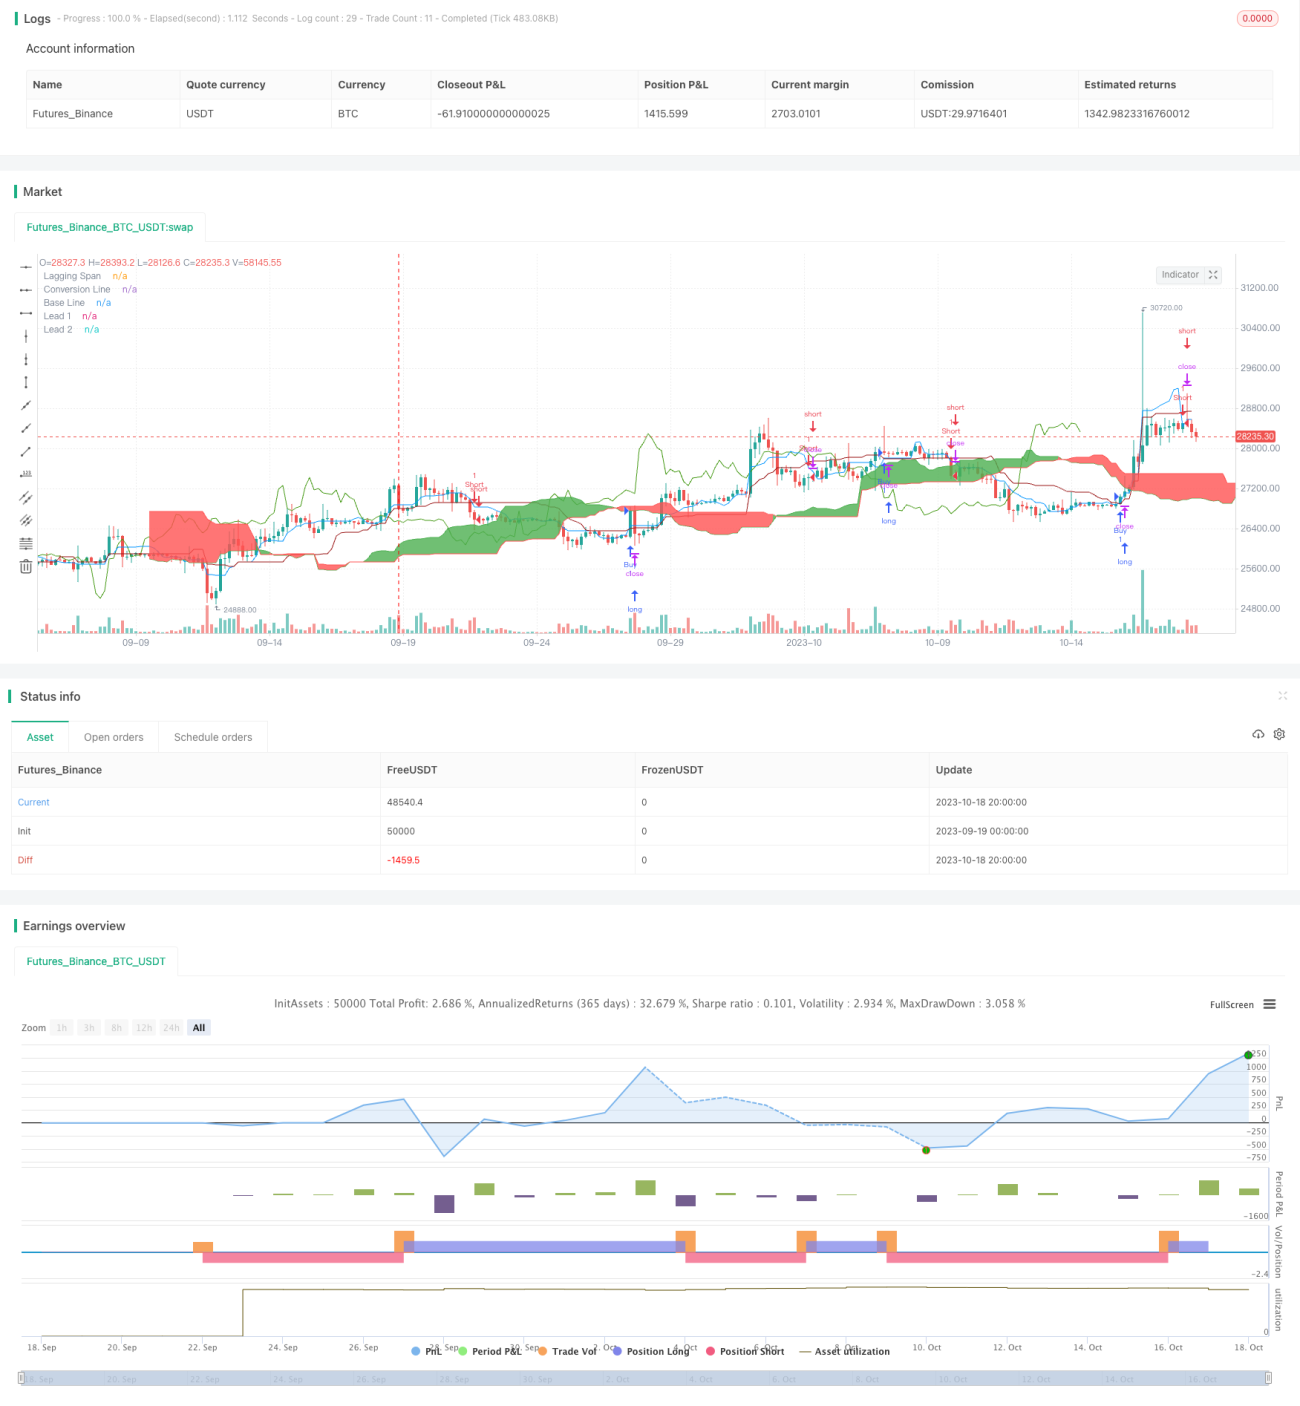
The Ichimoku Lagging Cross Dual Line trading strategy is a common Ichimoku candlestick chart analysis trading strategy. This strategy uses the Ichimoku cloud bands and crossovers of two baseline lines to identify reversal points in the market. The Ichimoku lagging cross trading strategy has proven to be a profitable trading strategy.
Strategy Principles
This strategy mainly uses 5 baseline lines of the Ichimoku candlesticks. It is necessary to first understand the meaning of these lines:
Tenkan-Sen line, also called the Conversion Line, represents the midpoint of the last 9 candlesticks, and is calculated with the formula:
Kijun-Sen line, also called the Base Line, represents the midpoint of the last 26 candlesticks, and is calculated with the formula:
Chikou Span, also called the Lagging Span, lags behind the price (as the name suggests). The Lagging Span is plotted 26 periods back.
Senkou Span A, also called the Leading Span A, represents one of the Cloud boundaries and it is the midpoint between the Conversion Line and the Base Line: . This value is plotted 26 periods into the future and it is the faster Cloud boundary.
Senkou Span B, or the Leading Span B, represents the second Cloud boundary and it is the midpoint of the last 52 price bars: . This value is plotted 52 periods into the future and it is the slower Cloud boundary.
The trading rules with Ichimoku are very simple:
When the Conversion Line crosses above the Base Line, it triggers a buy signal.
When the Conversion Line crosses below the Base Line, it triggers a sell signal.
Advantage Analysis
The Ichimoku Lagging Cross Dual Line trading strategy has the following advantages:
-
Using crossover of Conversion and Base Lines to determine entries and exits, the strategy rules are simple and clear.
-
Using the cloud bands and boundaries to determine trend direction, it reduces false signals.
-
The lagging line lags behind the price and can confirm the trend.
-
The combination of multiple lines provides comprehensive market assessment and improves decision accuracy.
-
Can be used for trading analysis across various timeframes.
Risk Analysis
The Ichimoku Lagging Cross Dual Line trading strategy also has the following risks:
-
Improper parameter settings may generate excessive false signals.
-
Crossover signals may lag around trend reversals, unable to capture turning points timely.
-
Ichimoku may fail with violent price fluctuations.
-
Needs more indicators to confirm signals, limited effects when used alone.
-
Requires frequent monitoring, cannot be fully automated.
Optimization Directions
The Ichimoku Lagging Cross Dual Line trading strategy can be optimized in the following aspects:
-
Optimize line parameters, improve lagging line settings for more accurate signals.
-
Incorporate trend indices to anticipate trend reversals early.
-
Add FILTERS to filter out false signals.
-
Optimize stop loss and take profit points to control risks.
-
Test parameters across different products and timeframes.
-
Conduct backtesting for best parameter combinations.
Conclusion
The Ichimoku Lagging Cross Dual Line trading strategy uses simple conversion and base line crossovers to generate trade signals. It effectively uses the cloud bands to determine trend direction and filter out some noise. However, improper parameter settings can also produce false signals, requiring further optimizations. This strategy is easy to implement but best effects would need incorporating other indicators. With continuous testing and optimizations, this strategy can adapt to market changes timely, improving profitability while reducing risks.
- 1