Crossover Master - Reversal Breakout Strategy

Overview
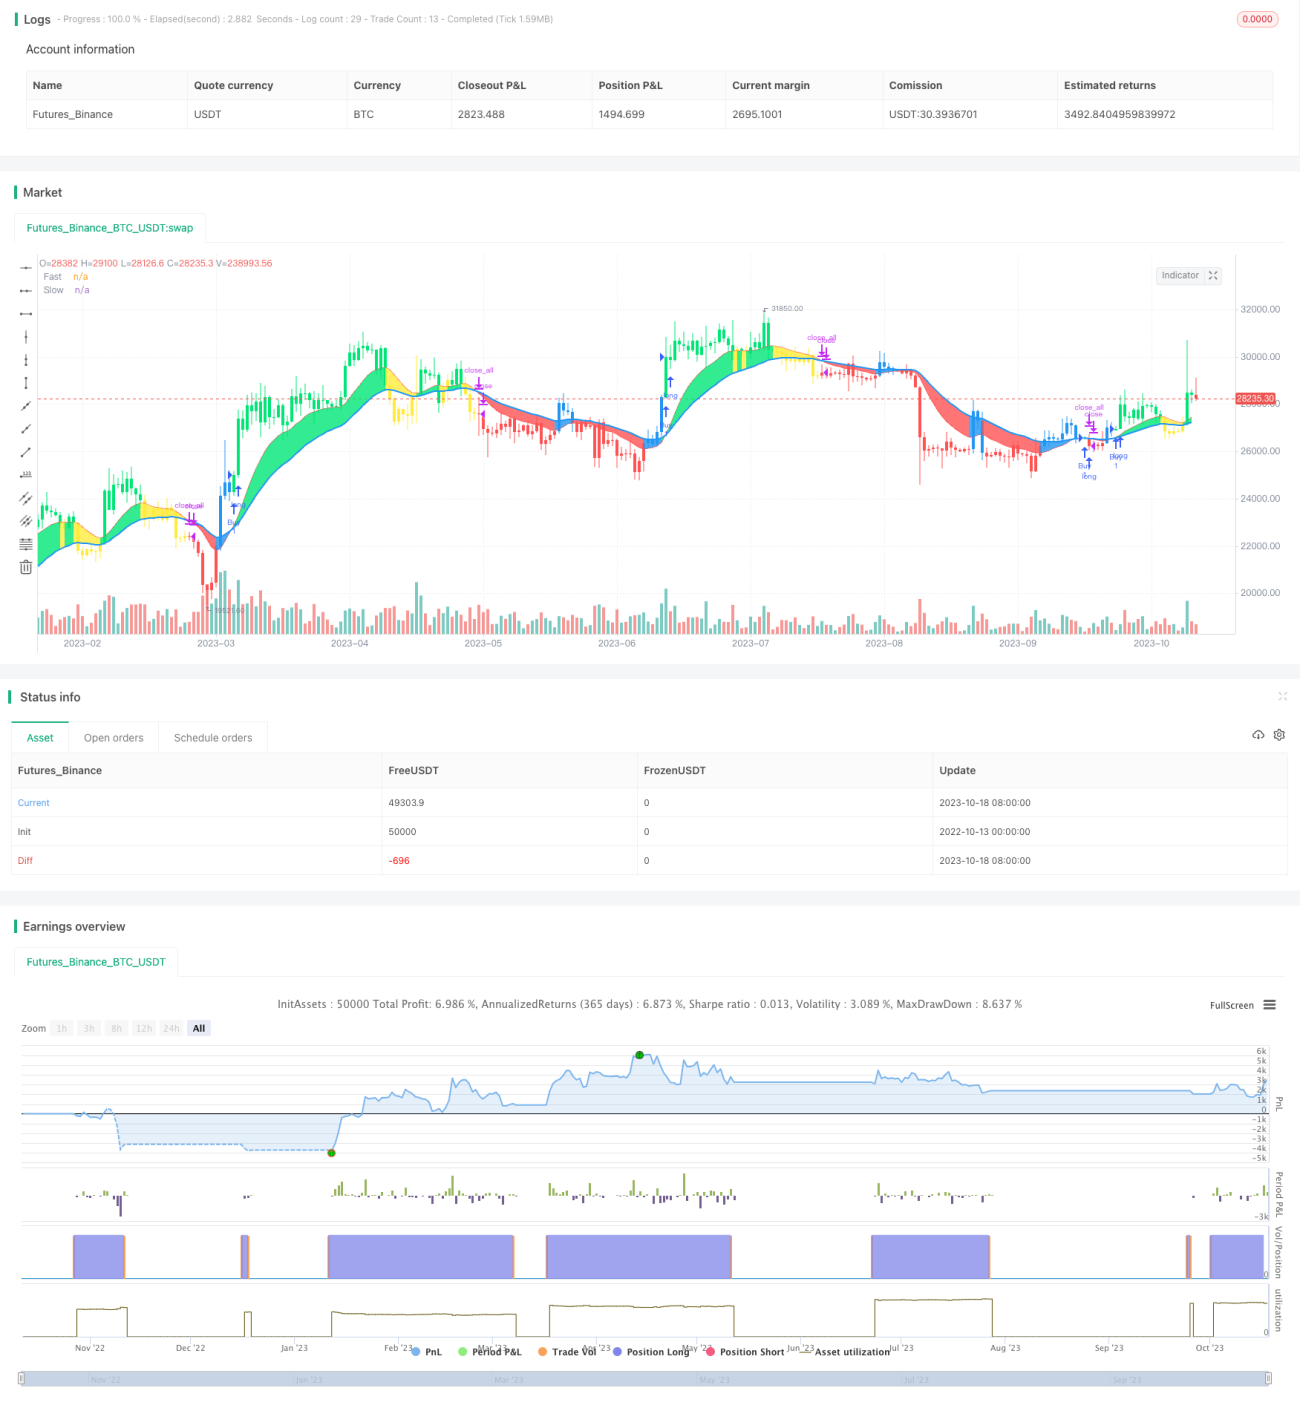
The Crossover Master - Reversal Breakout Strategy is a simple yet practical trading strategy based on moving averages. It uses the crossover of a fast moving average and a slow moving average as buy and sell signals. When the fast MA crosses above the slow MA, a buy signal is generated. When the fast MA crosses below the slow MA, a sell signal is generated. The strategy is suitable for medium volatility markets.
Strategy Logic
The strategy uses two moving averages: a short-term fast MA and a long-term slow MA. The fast MA period is 12, and the slow MA period is 26. The strategy first calculates the 2-day simple moving average of the ENDPOINT as price input, then computes the fast MA and slow MA. If the fast MA crosses above the slow MA, a buy signal is triggered. If the fast MA crosses below the slow MA, a sell signal is triggered.
Specifically, the strategy compares the values of the fast MA and slow MA to determine market trend. When the fast MA is greater than the slow MA, the market is considered to be in an uptrend (Bullish). When the fast MA is less than the slow MA, the market is considered to be in a downtrend (Bearish). The strategy combines with price momentum to generate signals during market reversals.
The buy signal logic is: when the market switches from downtrend to uptrend, i.e. the fast MA crosses above the slow MA, and the price is above the fast MA, a buy signal is generated.
The sell signal logic is: when the market switches from uptrend to downtrend, i.e. the fast MA crosses below the slow MA, and the price is below the fast MA, a sell signal is generated.
With this design, the strategy can capture reversal opportunities in a timely manner.
Advantage Analysis
The advantages of this strategy are:
-
The strategy logic is simple and clear, easy to understand and implement.
-
The moving average technique is mature and reliable, widely used.
-
The dual MA design can effectively filter market noise and identify trends.
-
Combining price momentum improves timing accuracy of trades.
-
Large optimization space for parameters according to market.
-
Stop loss can be added to control risks.
-
Moderate trading frequency, avoids overtrading.
-
Can be combined with other indicators like Bollinger Bands, RSI for enhancement.
-
Sufficient backtesting data to validate strategy performance.
Risk Analysis
The risks of this strategy include:
-
Dual MA strategies can generate false signals, missing trends or unnecessary trades.
-
MAs have lagging effect, may miss fast reversals.
-
Improper parameter settings lead to too high or low trading frequency.
-
The strategy is more suitable for medium-long term trading.
-
Unable to adapt to sudden market shocks.
-
Possibility of losses during certain periods.
-
Parameters need adjustment across different products.
-
Less effective during range-bound markets.
Risks can be reduced by:
-
Optimizing parameters according to market conditions.
-
Adding filters with other indicators.
-
Implementing stop loss to control losses.
-
Adjusting position sizing properly.
-
Testing and optimizing parameters by product.
Optimization Directions
The strategy can be optimized in the following aspects:
-
Optimize MA periods to fit current market better.
-
Test different types of MAs, like EMA, WMA etc.
-
Add volume indicator to confirm trends.
-
Combine other indicators like MACD, RSI for confluence.
-
Add stop loss techniques like trailing stop loss.
-
Optimize position sizing methods, e.g. fixed fractional, dynamic etc.
-
Test parameter optimization by time period and product.
-
Introduce machine learning for auto parameter tuning and signal validation.
-
Apply deep learning to detect more complex chart patterns.
-
Explore parameter-less strategy design concepts.
Continuous optimizations can improve the strategy's adaptiveness and achieve consistent results across varying market conditions.
Summary
In summary, the Crossover Master - Reversal Breakout Strategy has clear logic and practical value. It leverages the trend-following capacity of moving averages, and combines price momentum to improve signal quality. There is room for improving parameters and risk control. Overall, it provides a good example of a breakout strategy based on simple indicators, and can serve as a useful case study for quant strategy learning. With continuous enhancements, it has the potential to evolve into an adaptive effective strategy.
/*backtest
start: 2022-10-13 00:00:00
end: 2023-10-19 00:00:00
period: 1d
basePeriod: 1h
exchanges: [{"eid":"Futures_Binance","currency":"BTC_USDT"}]
*/

//@version=2
strategy("CDC Action Zone V.2 strategy", overlay=true)
// Credit Script base from CDC Action Zone V.2 by piriya33
// CDC ActionZone V2 29 Sep 2016- 1